Control - Rollup
The rollup field allows you to aggregate data from multiple related records or subform entries. For example, you can calculate the sum or average of a numeric field, count related records, or retrieve the latest value from a date field.
Example 1:
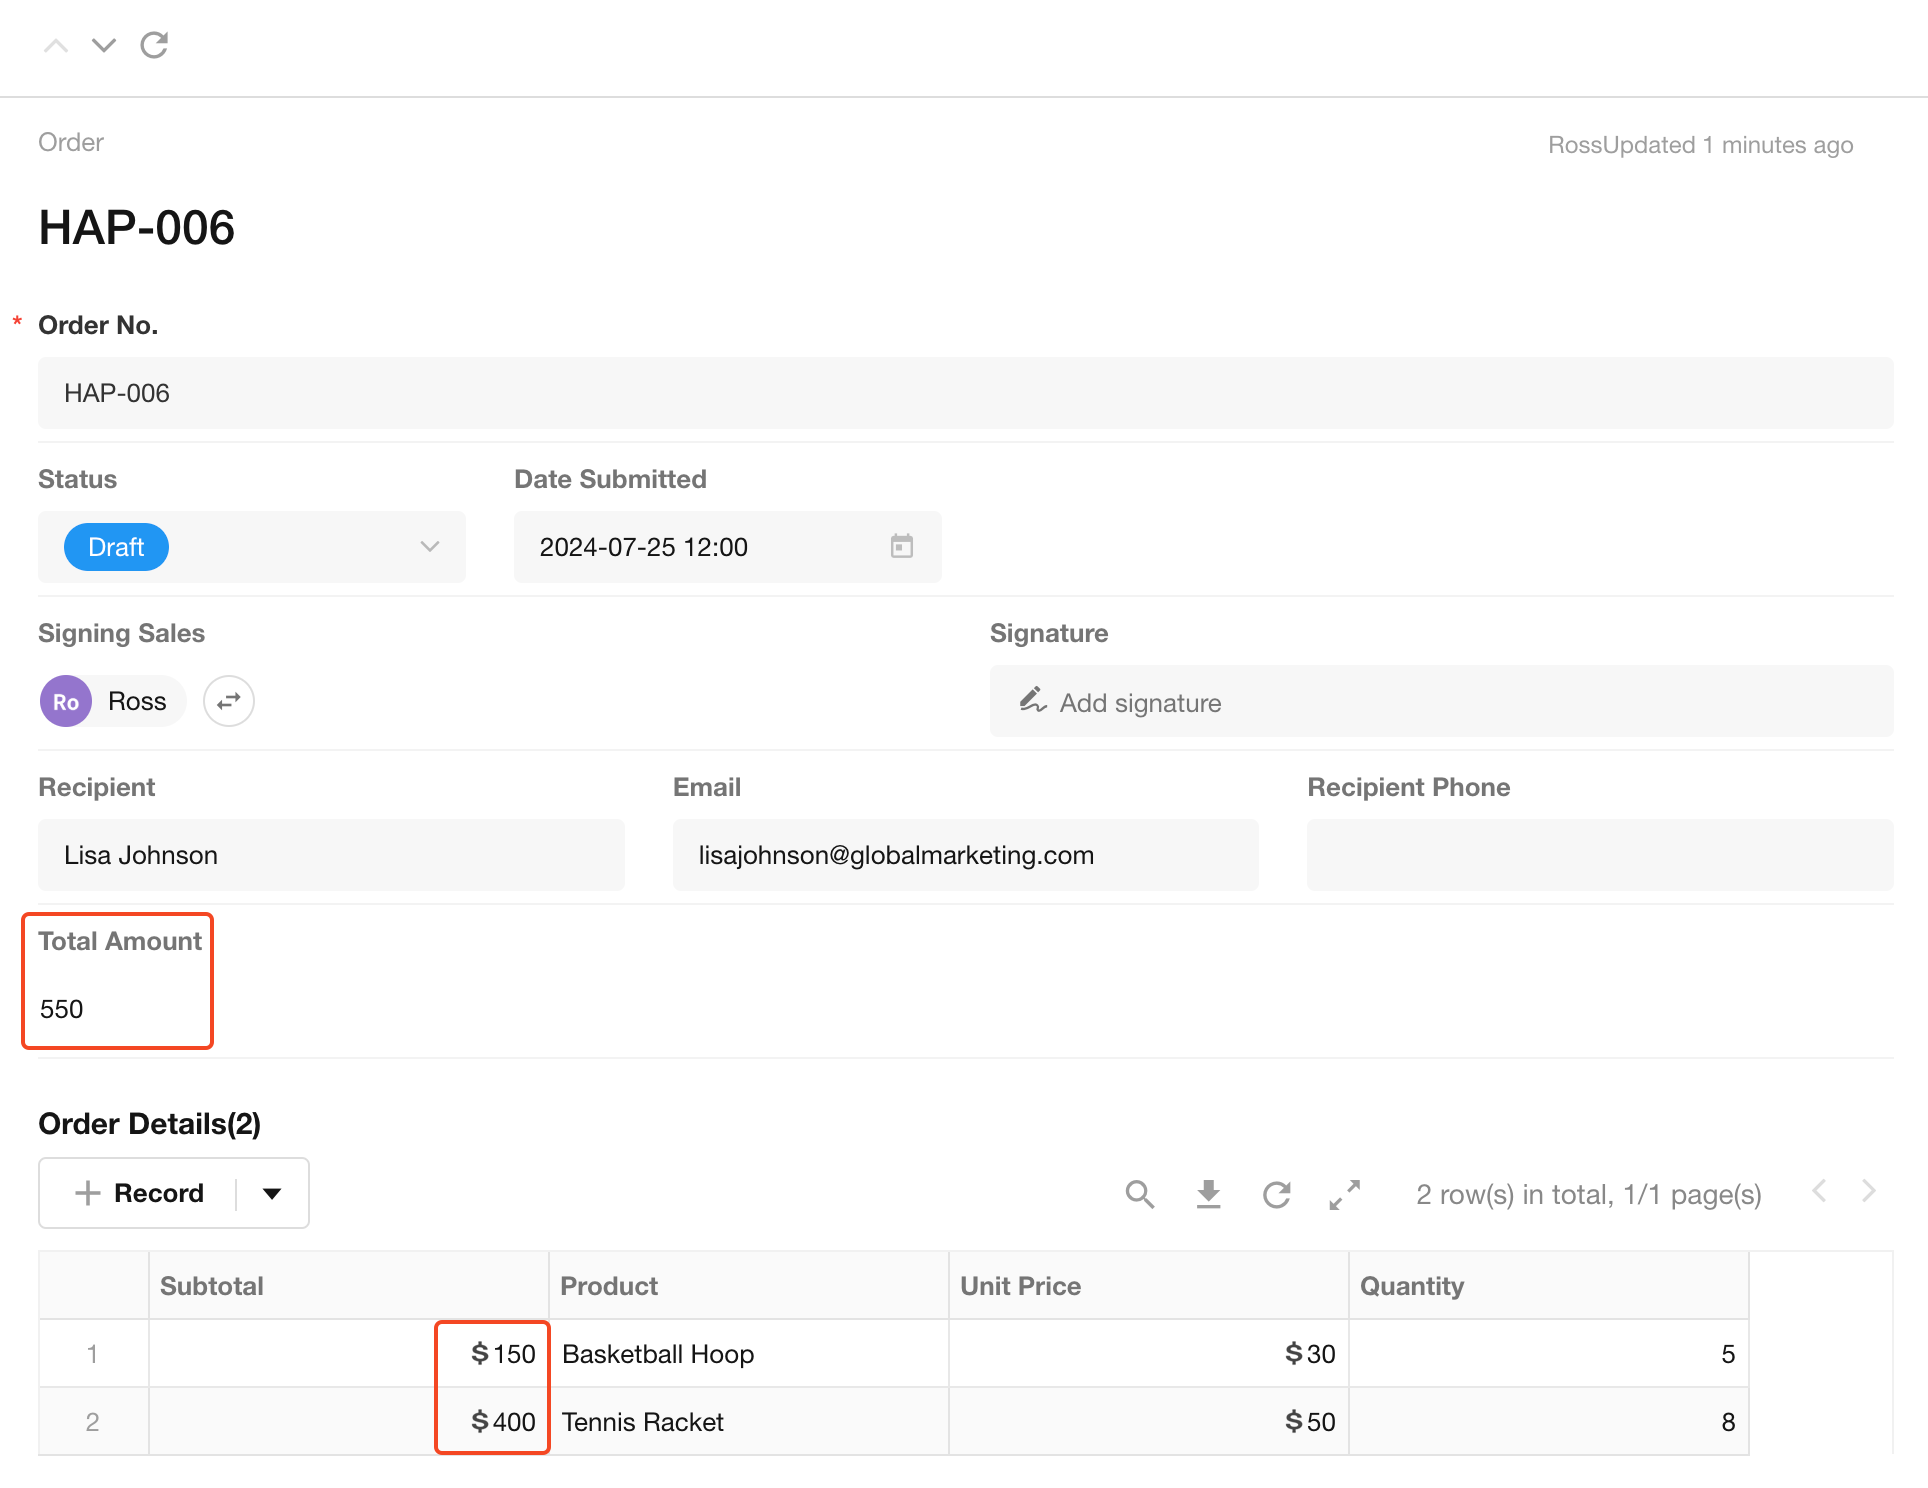
In the Order worksheet, each order record contains multiple order detail records (either via a subform or relationship field). You may need to automatically sum the subtotal amount of each product from the order details.
Example 2:
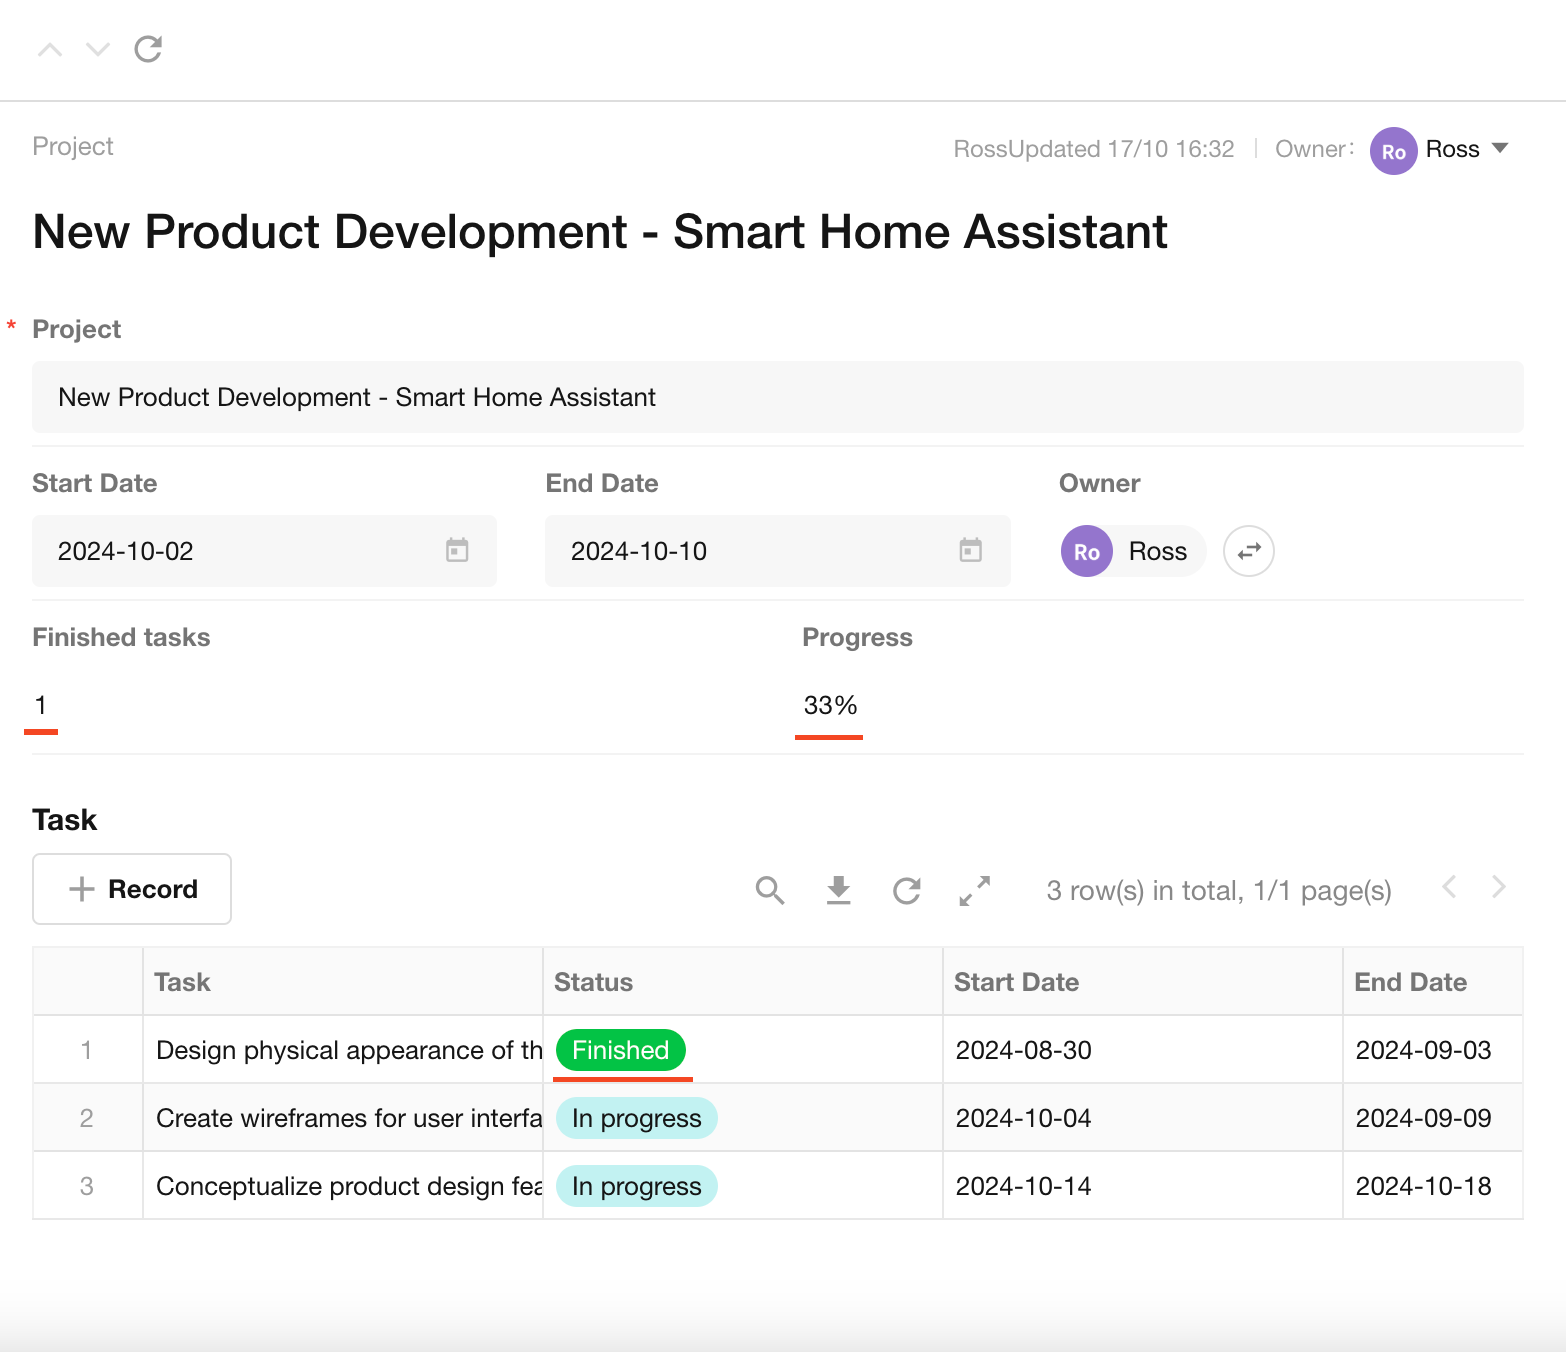
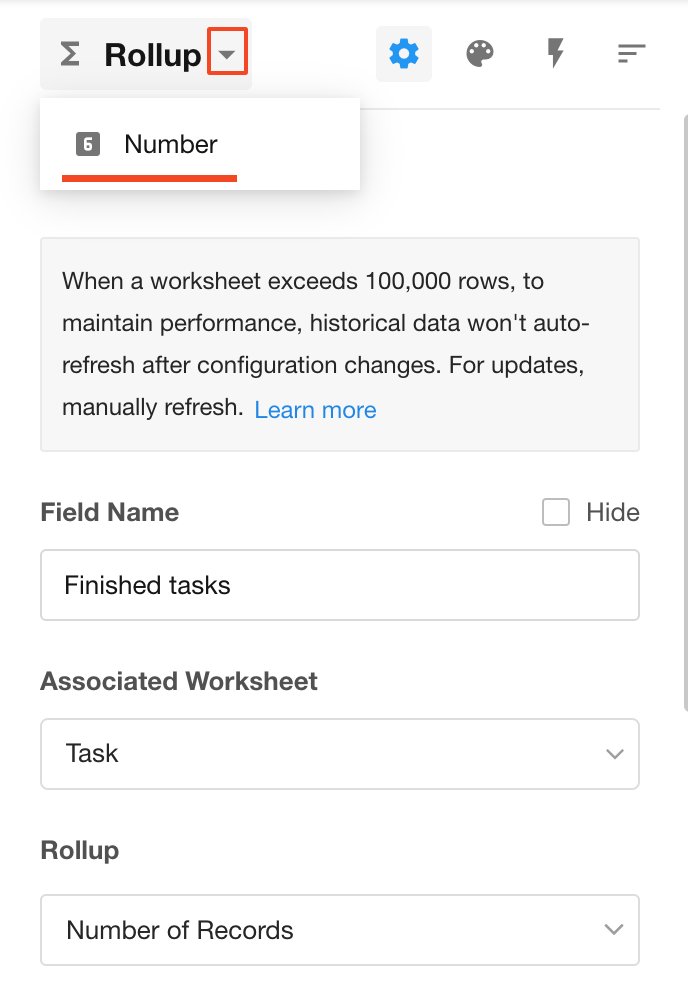
In the Project worksheet, a project may contain multiple task records. You may want to count the number of completed and incomplete tasks—i.e., aggregate records within a specific scope.
All scenarios like the above can be implemented using a rollup field.
Field Configuration
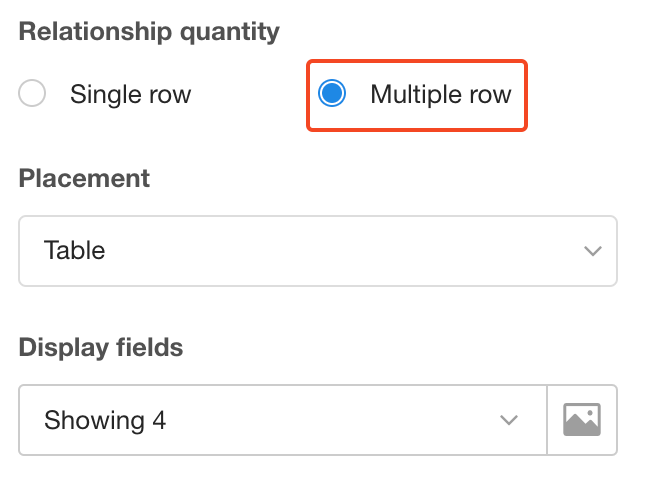
- Select a relationship field (multiple records) or a subform field in the current worksheet to define which records to aggregate.
- Choose the field to aggregate and the aggregation method.
- Set the aggregation scope (optional filtering).
- Configure the display format for the aggregated result.
Example
Example 1: Summing Order Detail Amounts in an Order Record
Go to the Order worksheet form editor and add a rollup field.
Configuration:
-
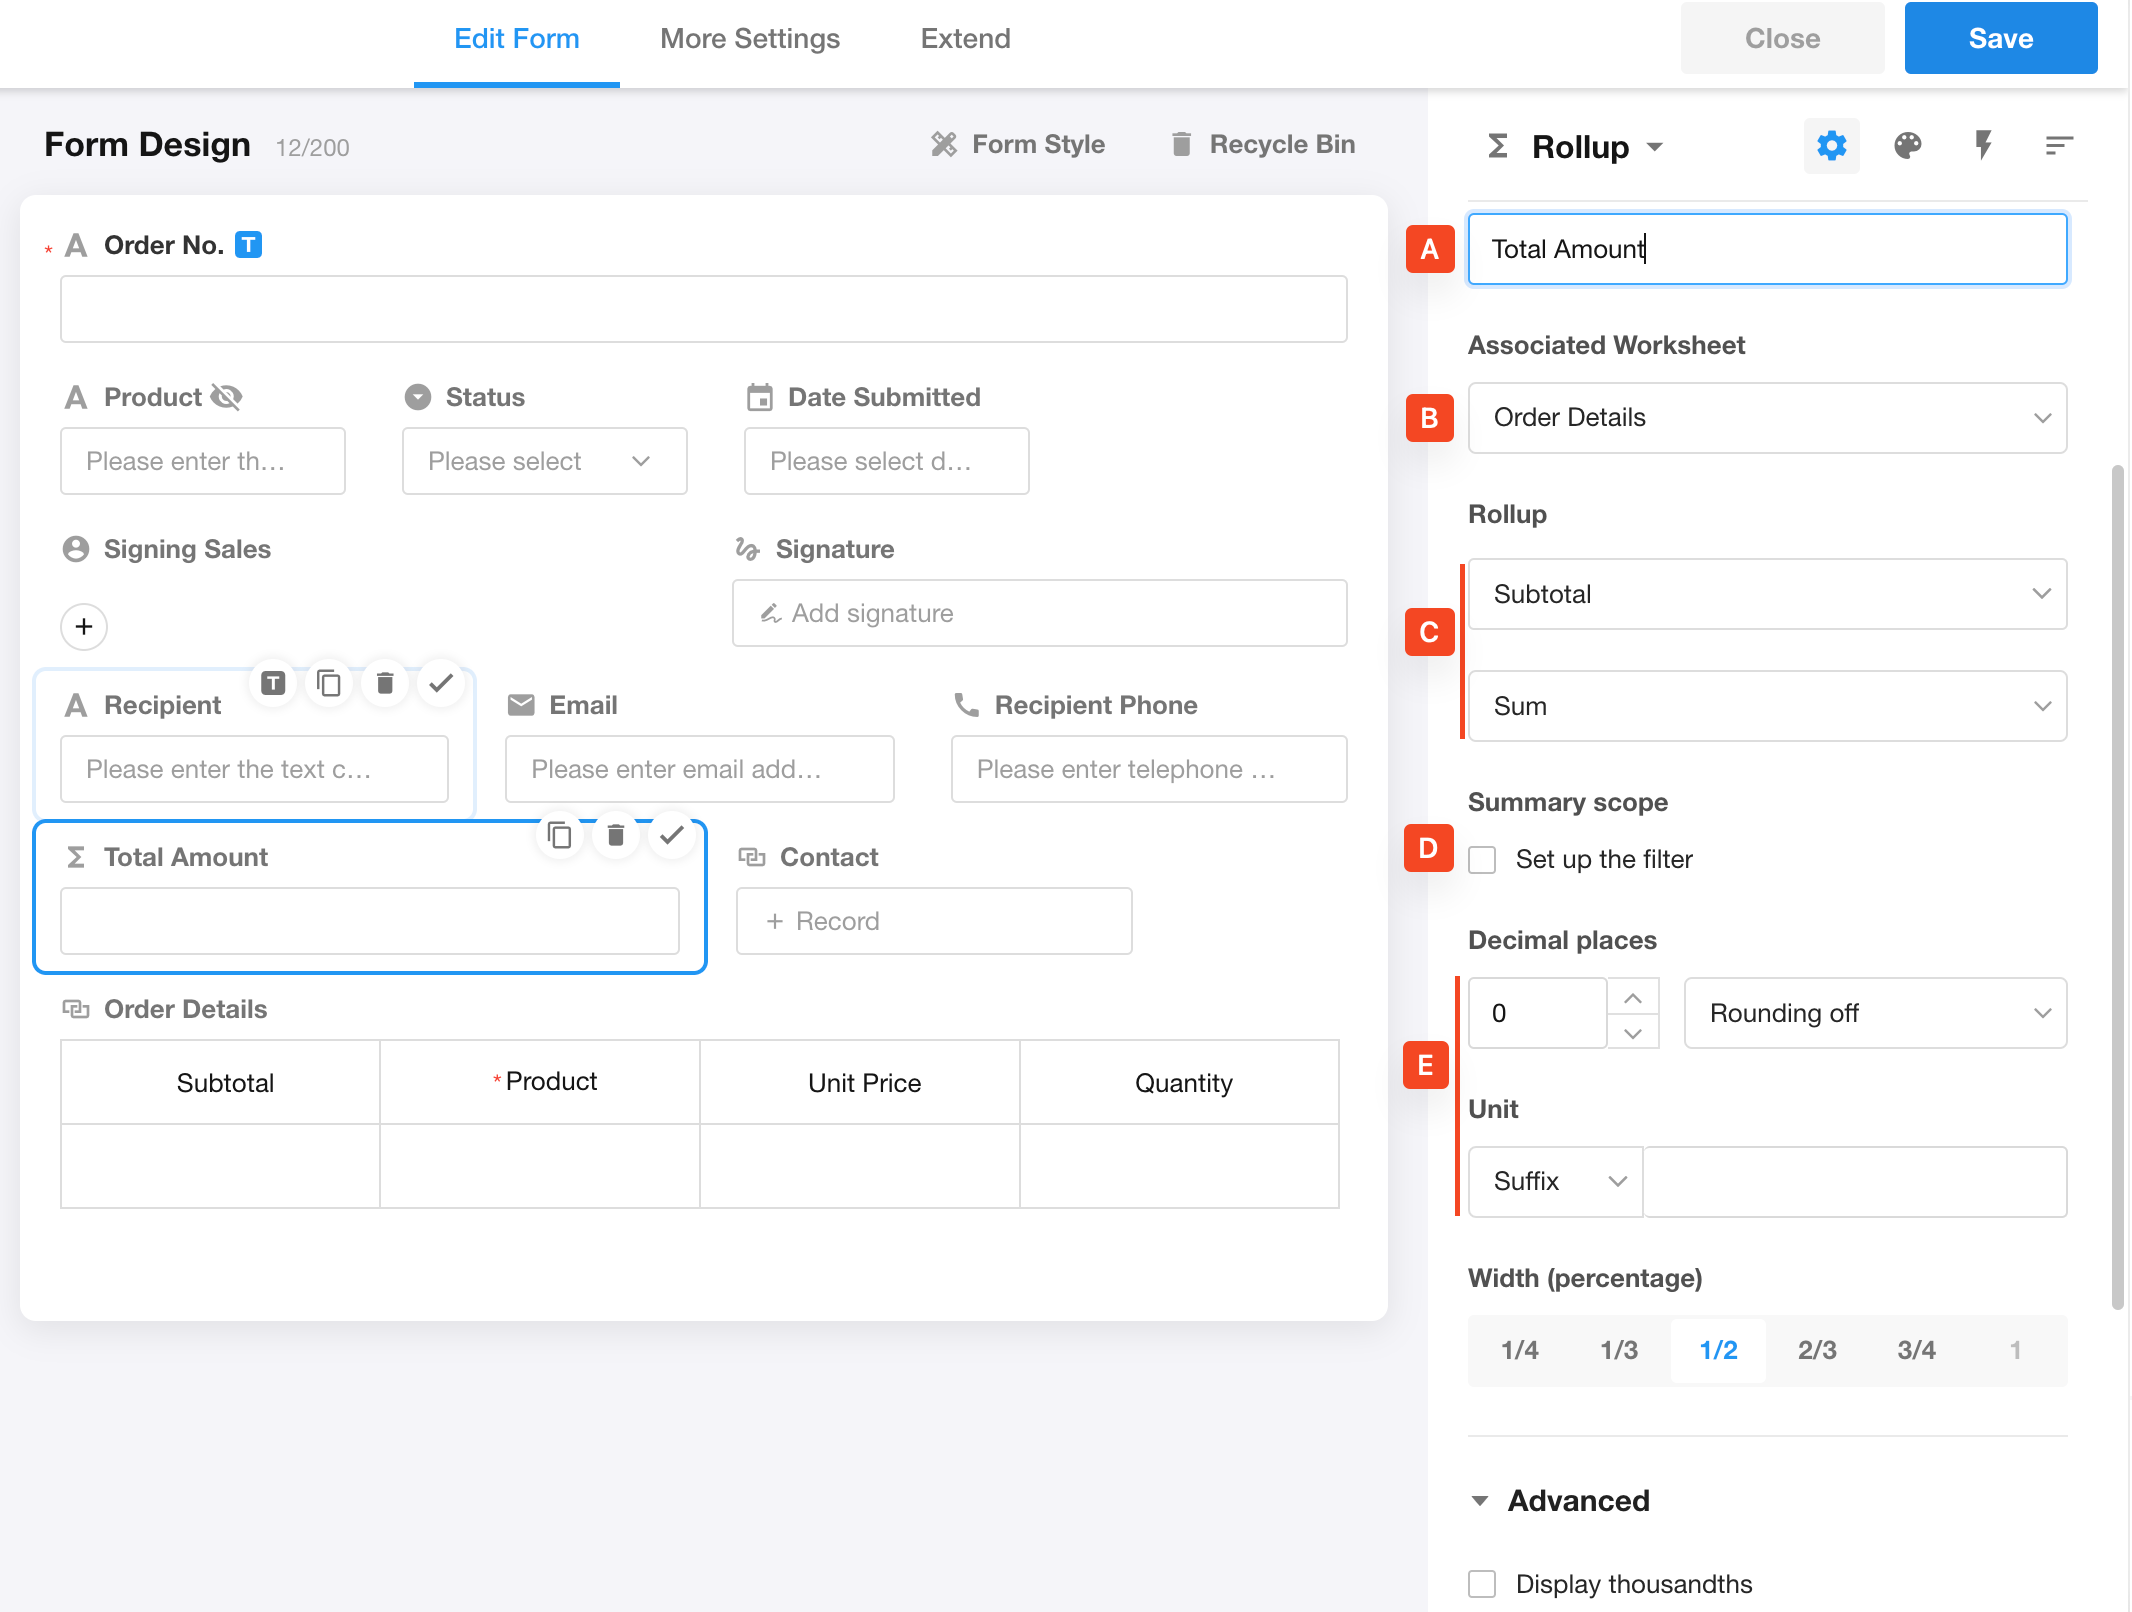
A. Field Name
Define a name for the aggregated result, such as Total Amount. -
B. Related Worksheet
Select the related worksheet to aggregate. Choose an existing relationship field in the current worksheet (e.g., "Order Details").Only relationship fields (multiple related records) in the current worksheet can be selected.
-
C. Aggregation Method
Select the field and aggregation type. For example, sum the Subtotal field in the Order Details worksheet.
Supported aggregation methods vary by field type:
- Currency / Numeric fields: Sum, Max, Min, Average
- Date/Time fields: Earliest or Latest value
- Other field types: Count of filled vs. empty items
-
D. Aggregation Scope
Sometimes you only need to aggregate records that meet specific conditions, rather than all related records. See Example 2 for details. -
E. Display Format
Customize how the aggregated result is displayed, such as decimal places, thousand separators, percentage format, or units.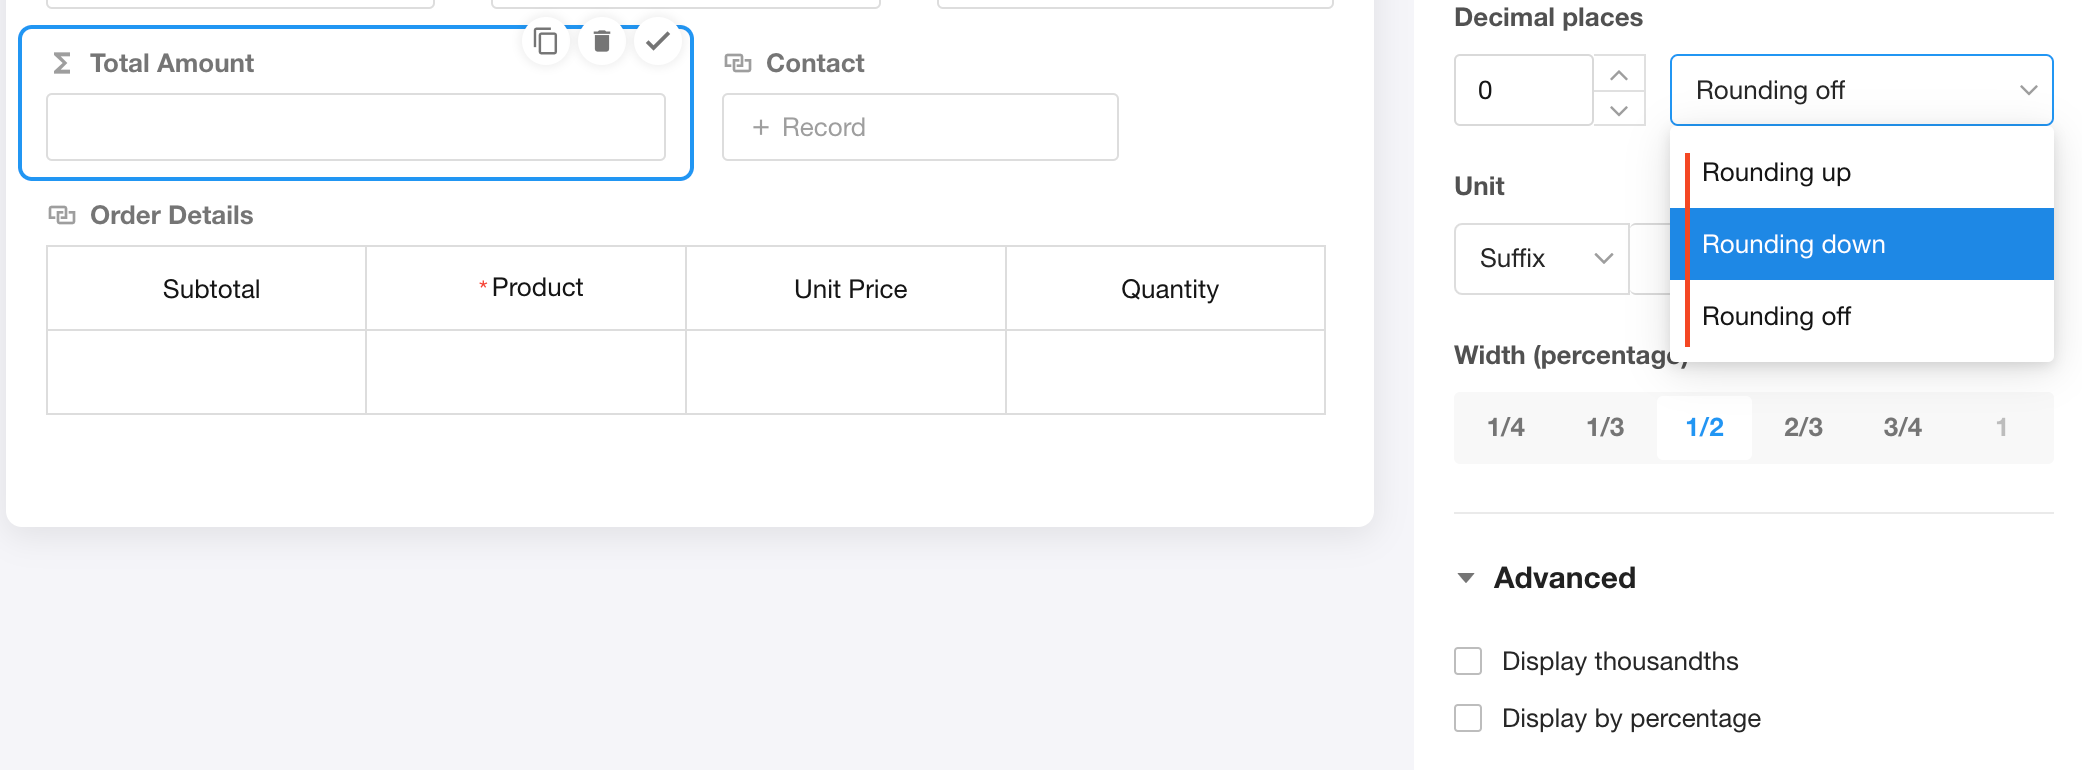
-
Display as Percentage
The result is automatically multiplied by 100.
For example:- Value = 1 → Displayed as 100%
- Value = 0.99 → Displayed as 99%
-
When percentage display is enabled, units (prefix/suffix) will not be shown.
-
Example 2: Count Complete Tasks Under a Project and Calculate Their Percentage
Open the Project worksheet form editor and add a rollup field.
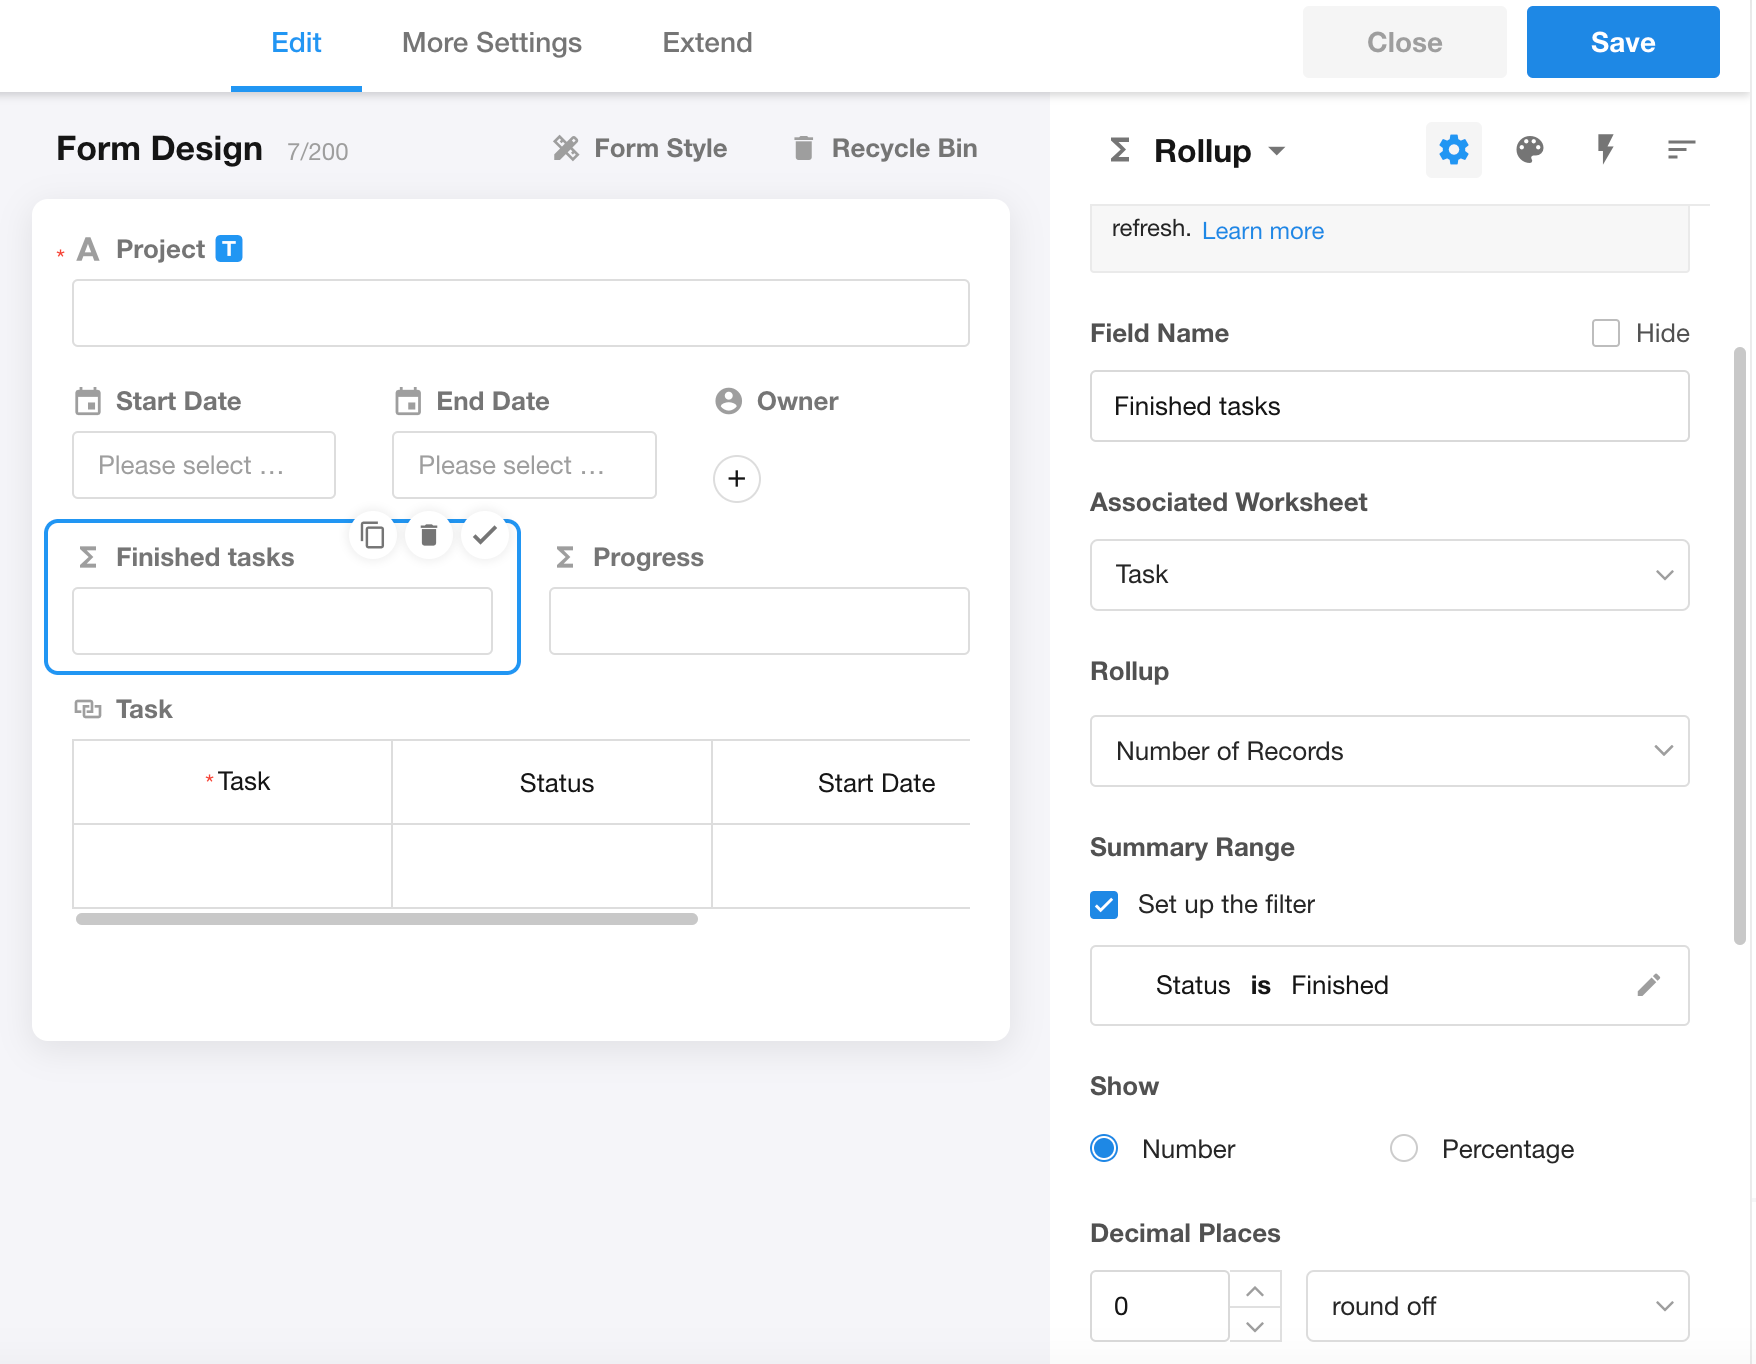
In the aggregation scope, enable Set up the filter to define which related records should be included.
1. Define the Aggregation Scope
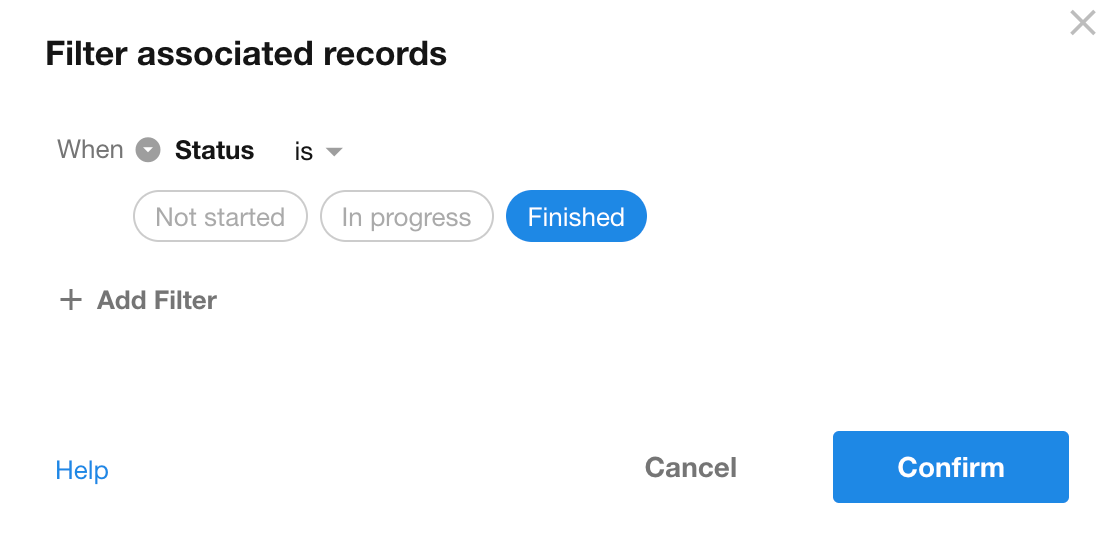
The filter can consist of:
- A single filter condition, or
- Multiple conditions combined
For multiple conditions, the relationship must be either all AND or all OR.
Note: Dynamic values (variables) are not supported in filter conditions.
For example, "Date = Today" is considered a dynamic value and is not supported here.
If dynamic conditions are required, use a chart for aggregation instead.
2. Display Format of Aggregated Results
For partial data aggregation, you can display:
- The raw value, or
- Its percentage relative to the total
When aggregating record counts or sum of number/currency fields, the result can be displayed as a percentage.
Percentage = Aggregated value within the scope / Aggregated value of all records
Converted to a number field:
Maximum Number of Records for Rollup
A rollup field can aggregate up to 1,000 related records or subform entries.
To aggregate all related records, use one of the following methods:
- Open the record detail and click the refresh button next to the rollup field
- Use the "Calibrate Single Data" option in the workflow Calibrate Node
Rollup Field Update Mechanism
Rollup fields support two update mechanisms:
- Immediate Update
- Delayed Update
"Update" refers to the value stored in the database. It does not necessarily mean the field value in the UI is refreshed instantly.
Using an Order worksheet (main worksheet) and Order Details worksheet (related worksheet) as an example:
Immediate Updates
The rollup result is updated immediately in the following cases:
- Editing related records directly within the main worksheet record
- Clicking the refresh button on the rollup field in the main worksheet
- Performing batch data calibration
- Using the workflow Calibrate Node
- Updating relationships via workflow (e.g., adding or removing related records)
Delayed Updates
The rollup result may be delayed in the following cases:
- Editing records directly in the related worksheet
- Updating related worksheet fields via workflow
In these cases, the rollup field in the main worksheet is recalculated asynchronously, which may cause a delay.
Since rollup results may be delayed, if a workflow depends on the latest aggregated values, it is recommended to:
- Use the Calibrate Node to refresh the rollup field, or
- Use the Rollup Node to retrieve the latest aggregation result
Recommended Use Cases for Rollup Fields
Suitable Scenarios
- Aggregating a small number of records (typically around or slightly above 100 records)
- Data changes are infrequent, even if the total volume is large (generally under tens of thousands)
Not Suitable Scenarios
- Large-scale data aggregation where the data volume continuously grows over time
In such cases, using rollup fields is not recommended.
Was this document helpful?