Introduction to Usage Analysis
Usage analysis can help Admins keep track of a variety of data such as the usage of applications or the activity of members in the organization, including the following two types:
-
Total number
For example, the number of applications in the organization, the number of worksheets in an application, the number of workflows, etc.
They are real-time statistics, that is, the deadline is the current time.
-
Trend
For example, you can view daily visits of applications in the last 30 days, daily creation of records in the last week, and so on.
They are not real-time statistics, and current data is counted the next day.
1. Overview
Here you can view the total number of applications in the organization, the number of worksheets and the usage analysis for the last X days.
Aggregate Overview
Here displays the total number of applications, worksheets, records and workflows.
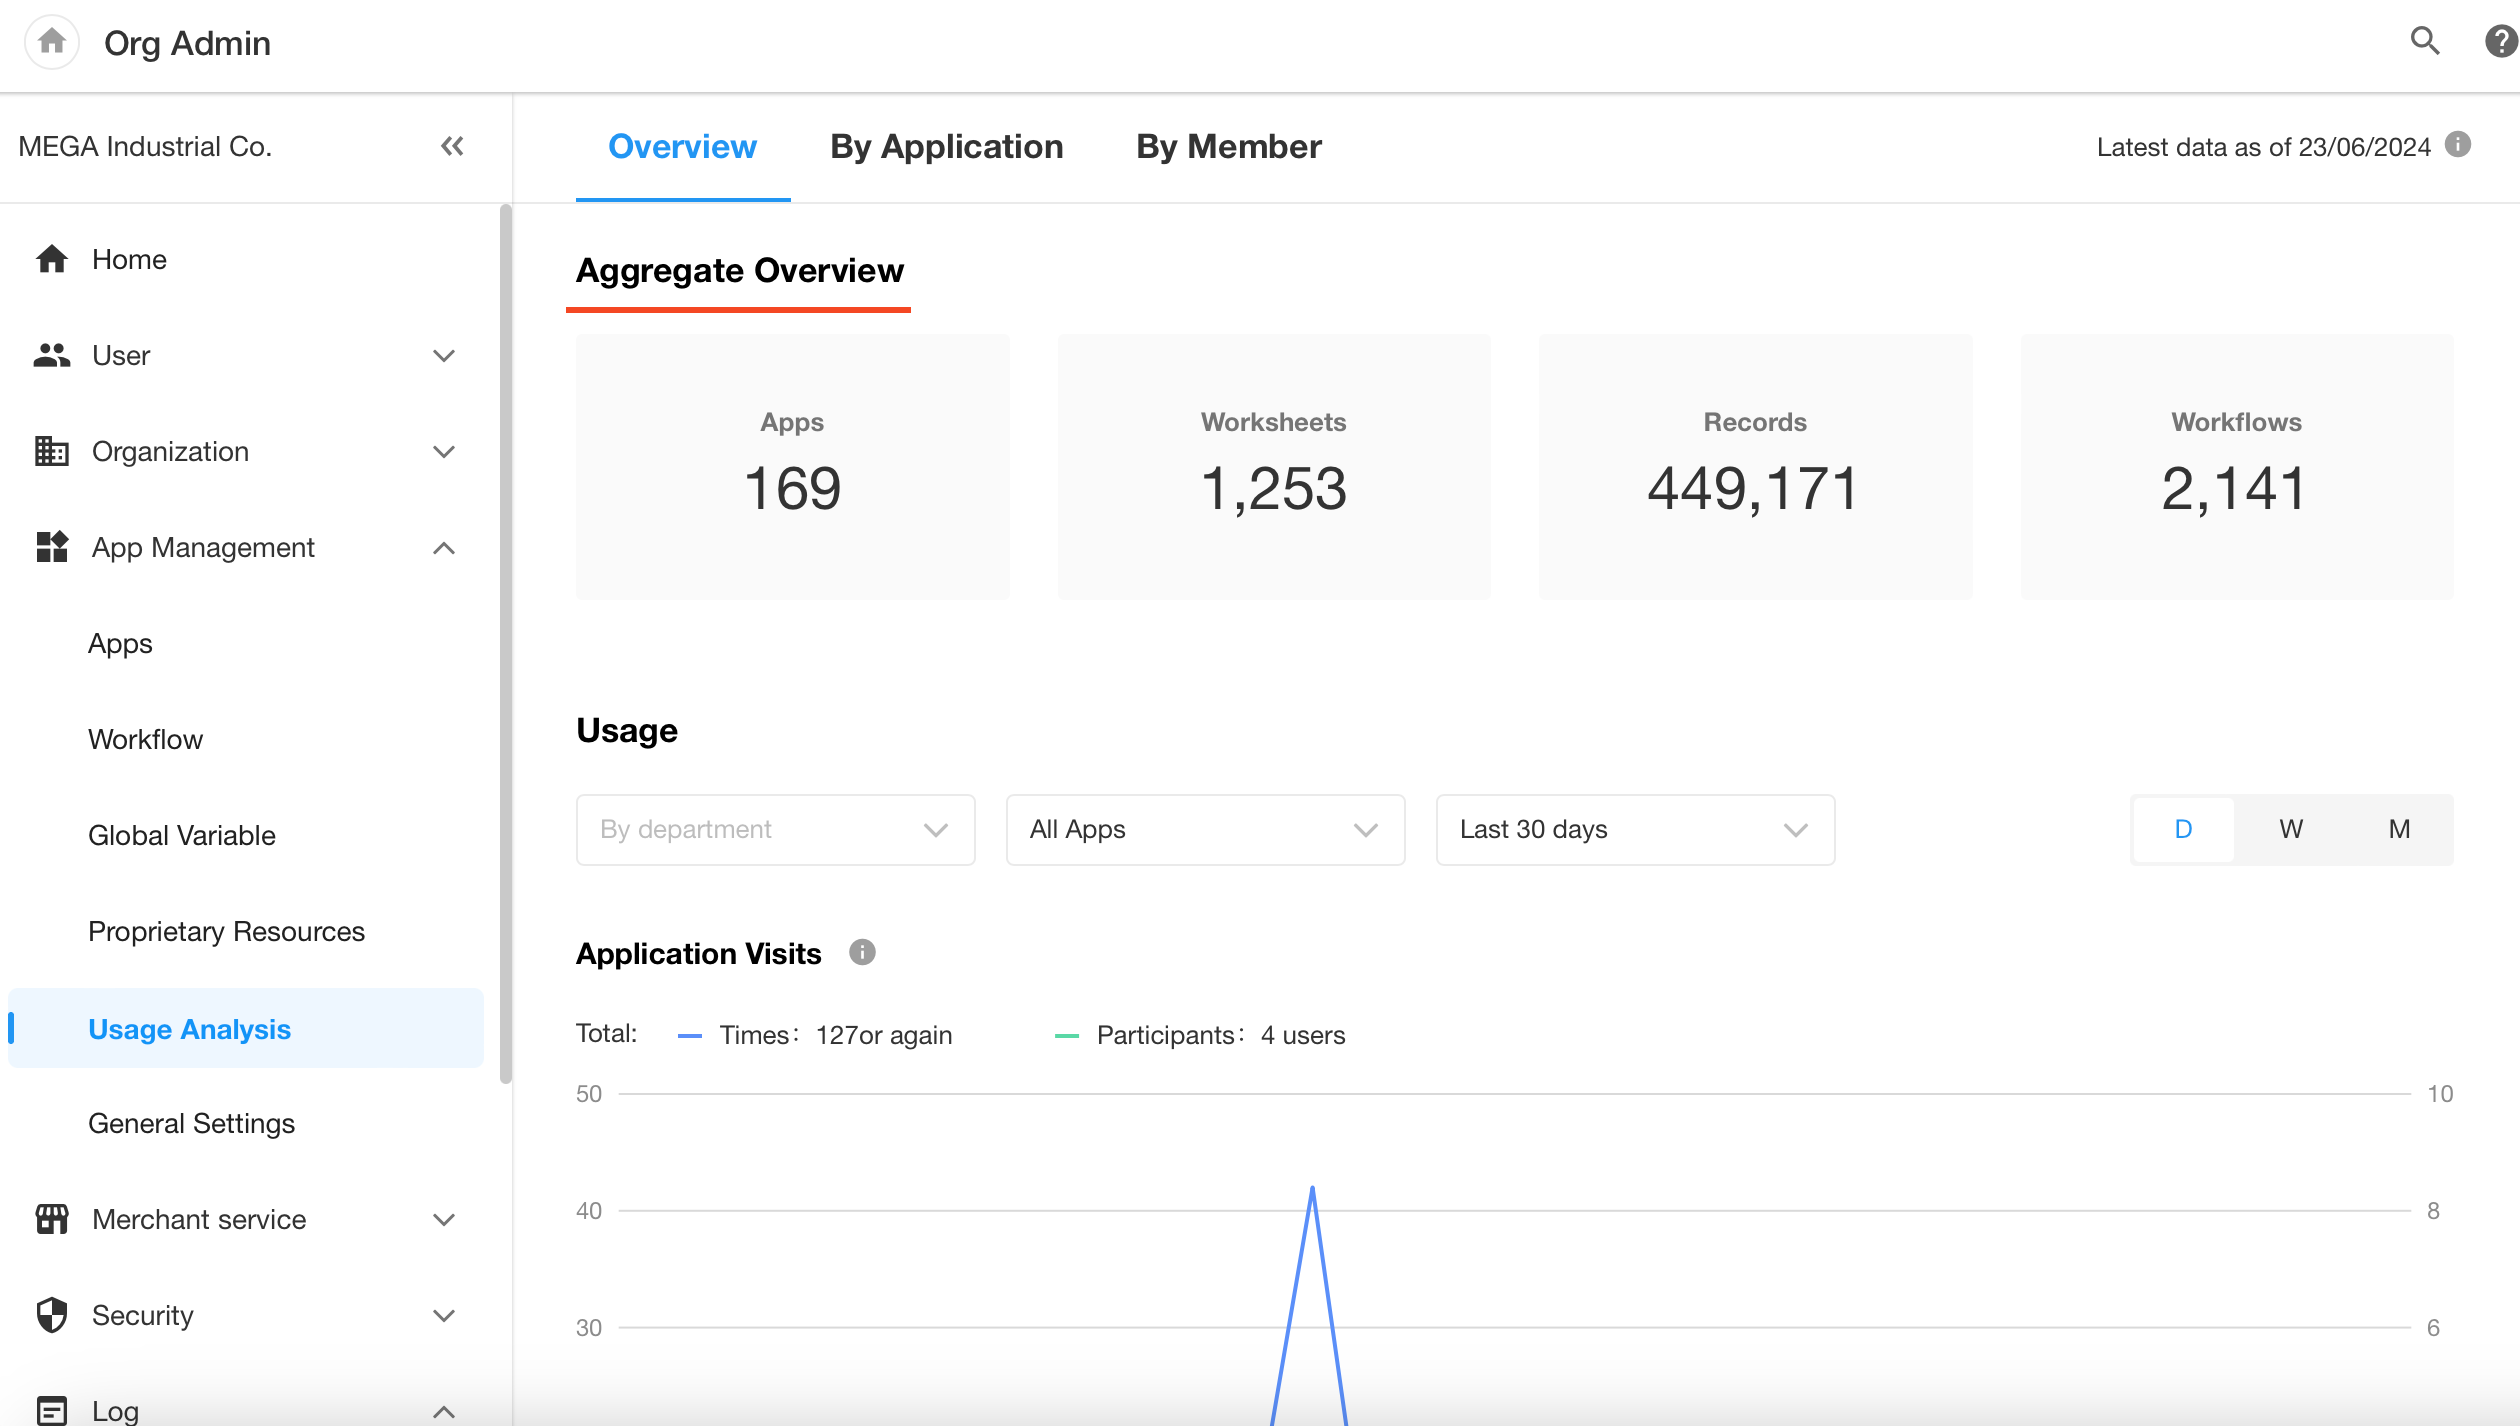
In particular, click [Apps] and [Workflows], you can view their details page.
-
Apps: number of applications in the organization
-
Worksheets: number of worksheets in all applications (excluding worksheets in Recycle Bin and excluding custom pages)
-
Records: number of records in all worksheets (excluding records in Recycle Bin)
-
Workflows: number of workflows in all applications (including closed ones)
Usage
Here you can view application visits (including visiting times and participants), record creations, workflow executions, and number of attachments in applications in the organization.
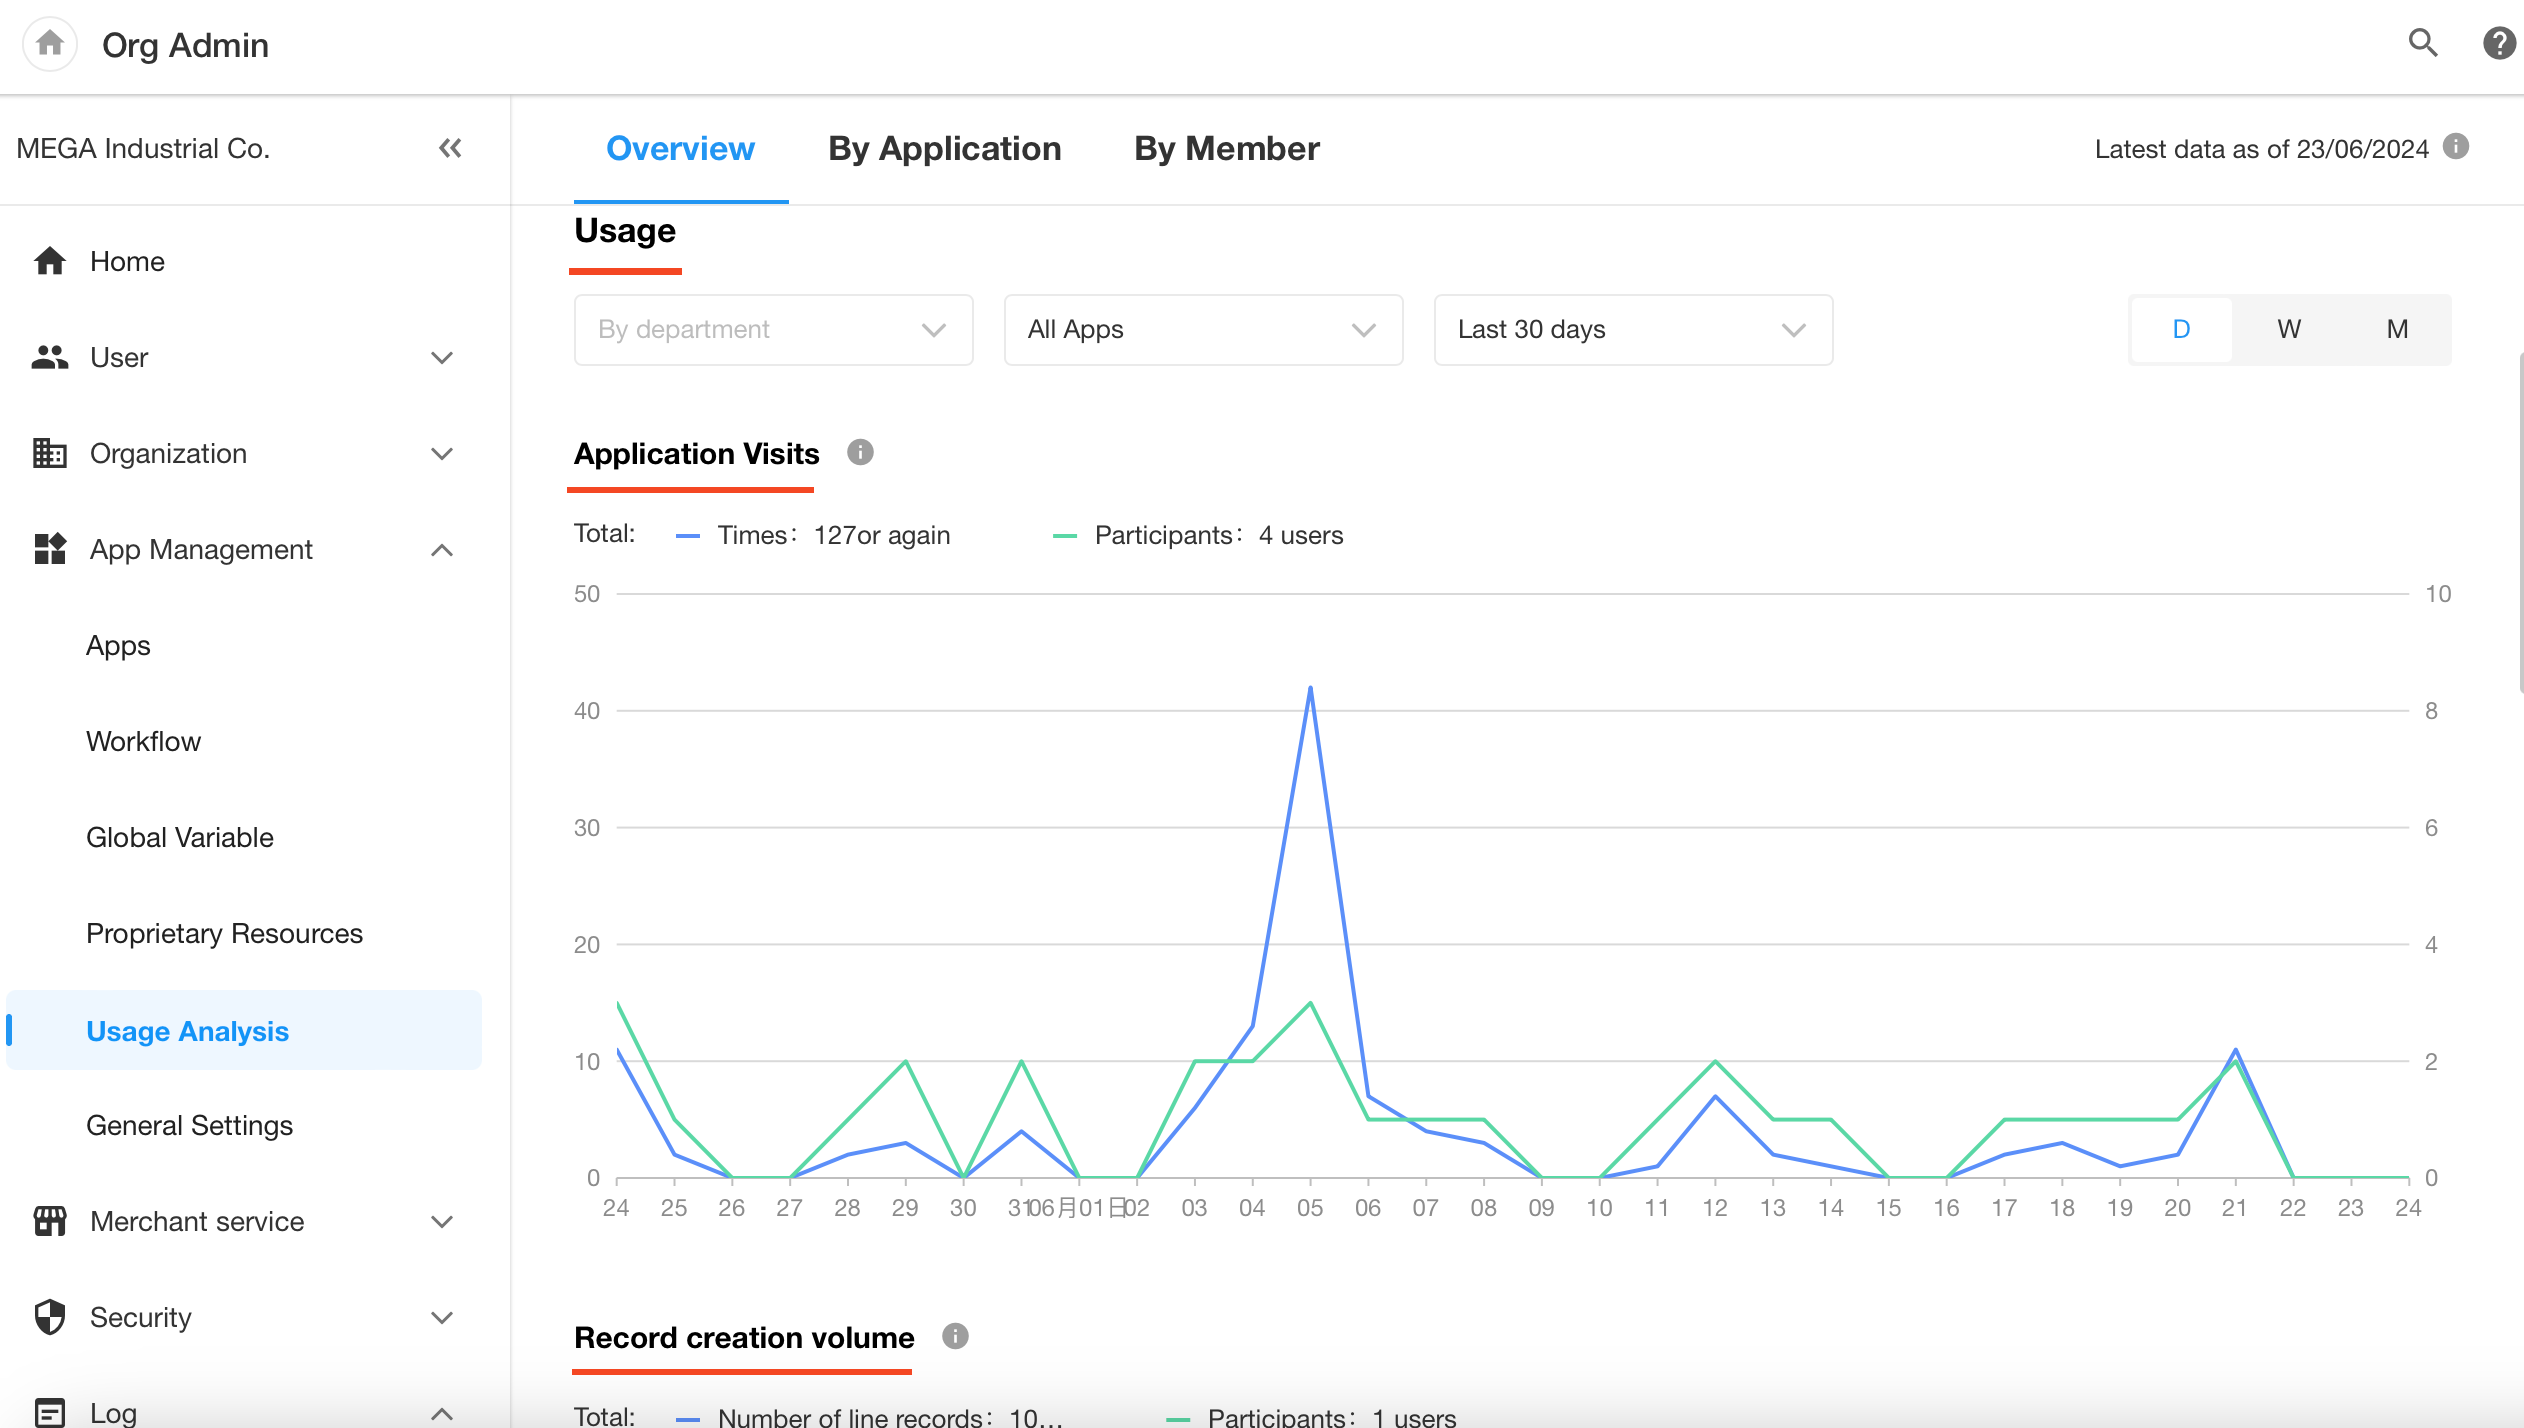
They are not real-time statistics here, and current data is counted the next day.
You can filter the data by department, application, time, etc. If time frame is more than 7 days, you can display data by day, by week, or by month.
-
Application Visits (times)
The following operations count:
-
Click the icon to enter the application
-
Refresh the page
-
Enter the application through the notification message
In an application, operations like switching worksheets or views do not count.
-
-
Application Visits (participants)
Multiple visits to an application by the same member in a day within the specified dimension are counted as one member.
-
Record Creations
Records created in various ways are all counted.
-
Workflow Executions
It cannot be counted by part.
-
Attachments
The files in the attachment field, and files uploaded in the discussion are counted.
2. By Application
Aggregate Overview
Here it shows the total number of worksheets, workflows, and records in each application (including closed applications). Data in each column can be sorted to view.
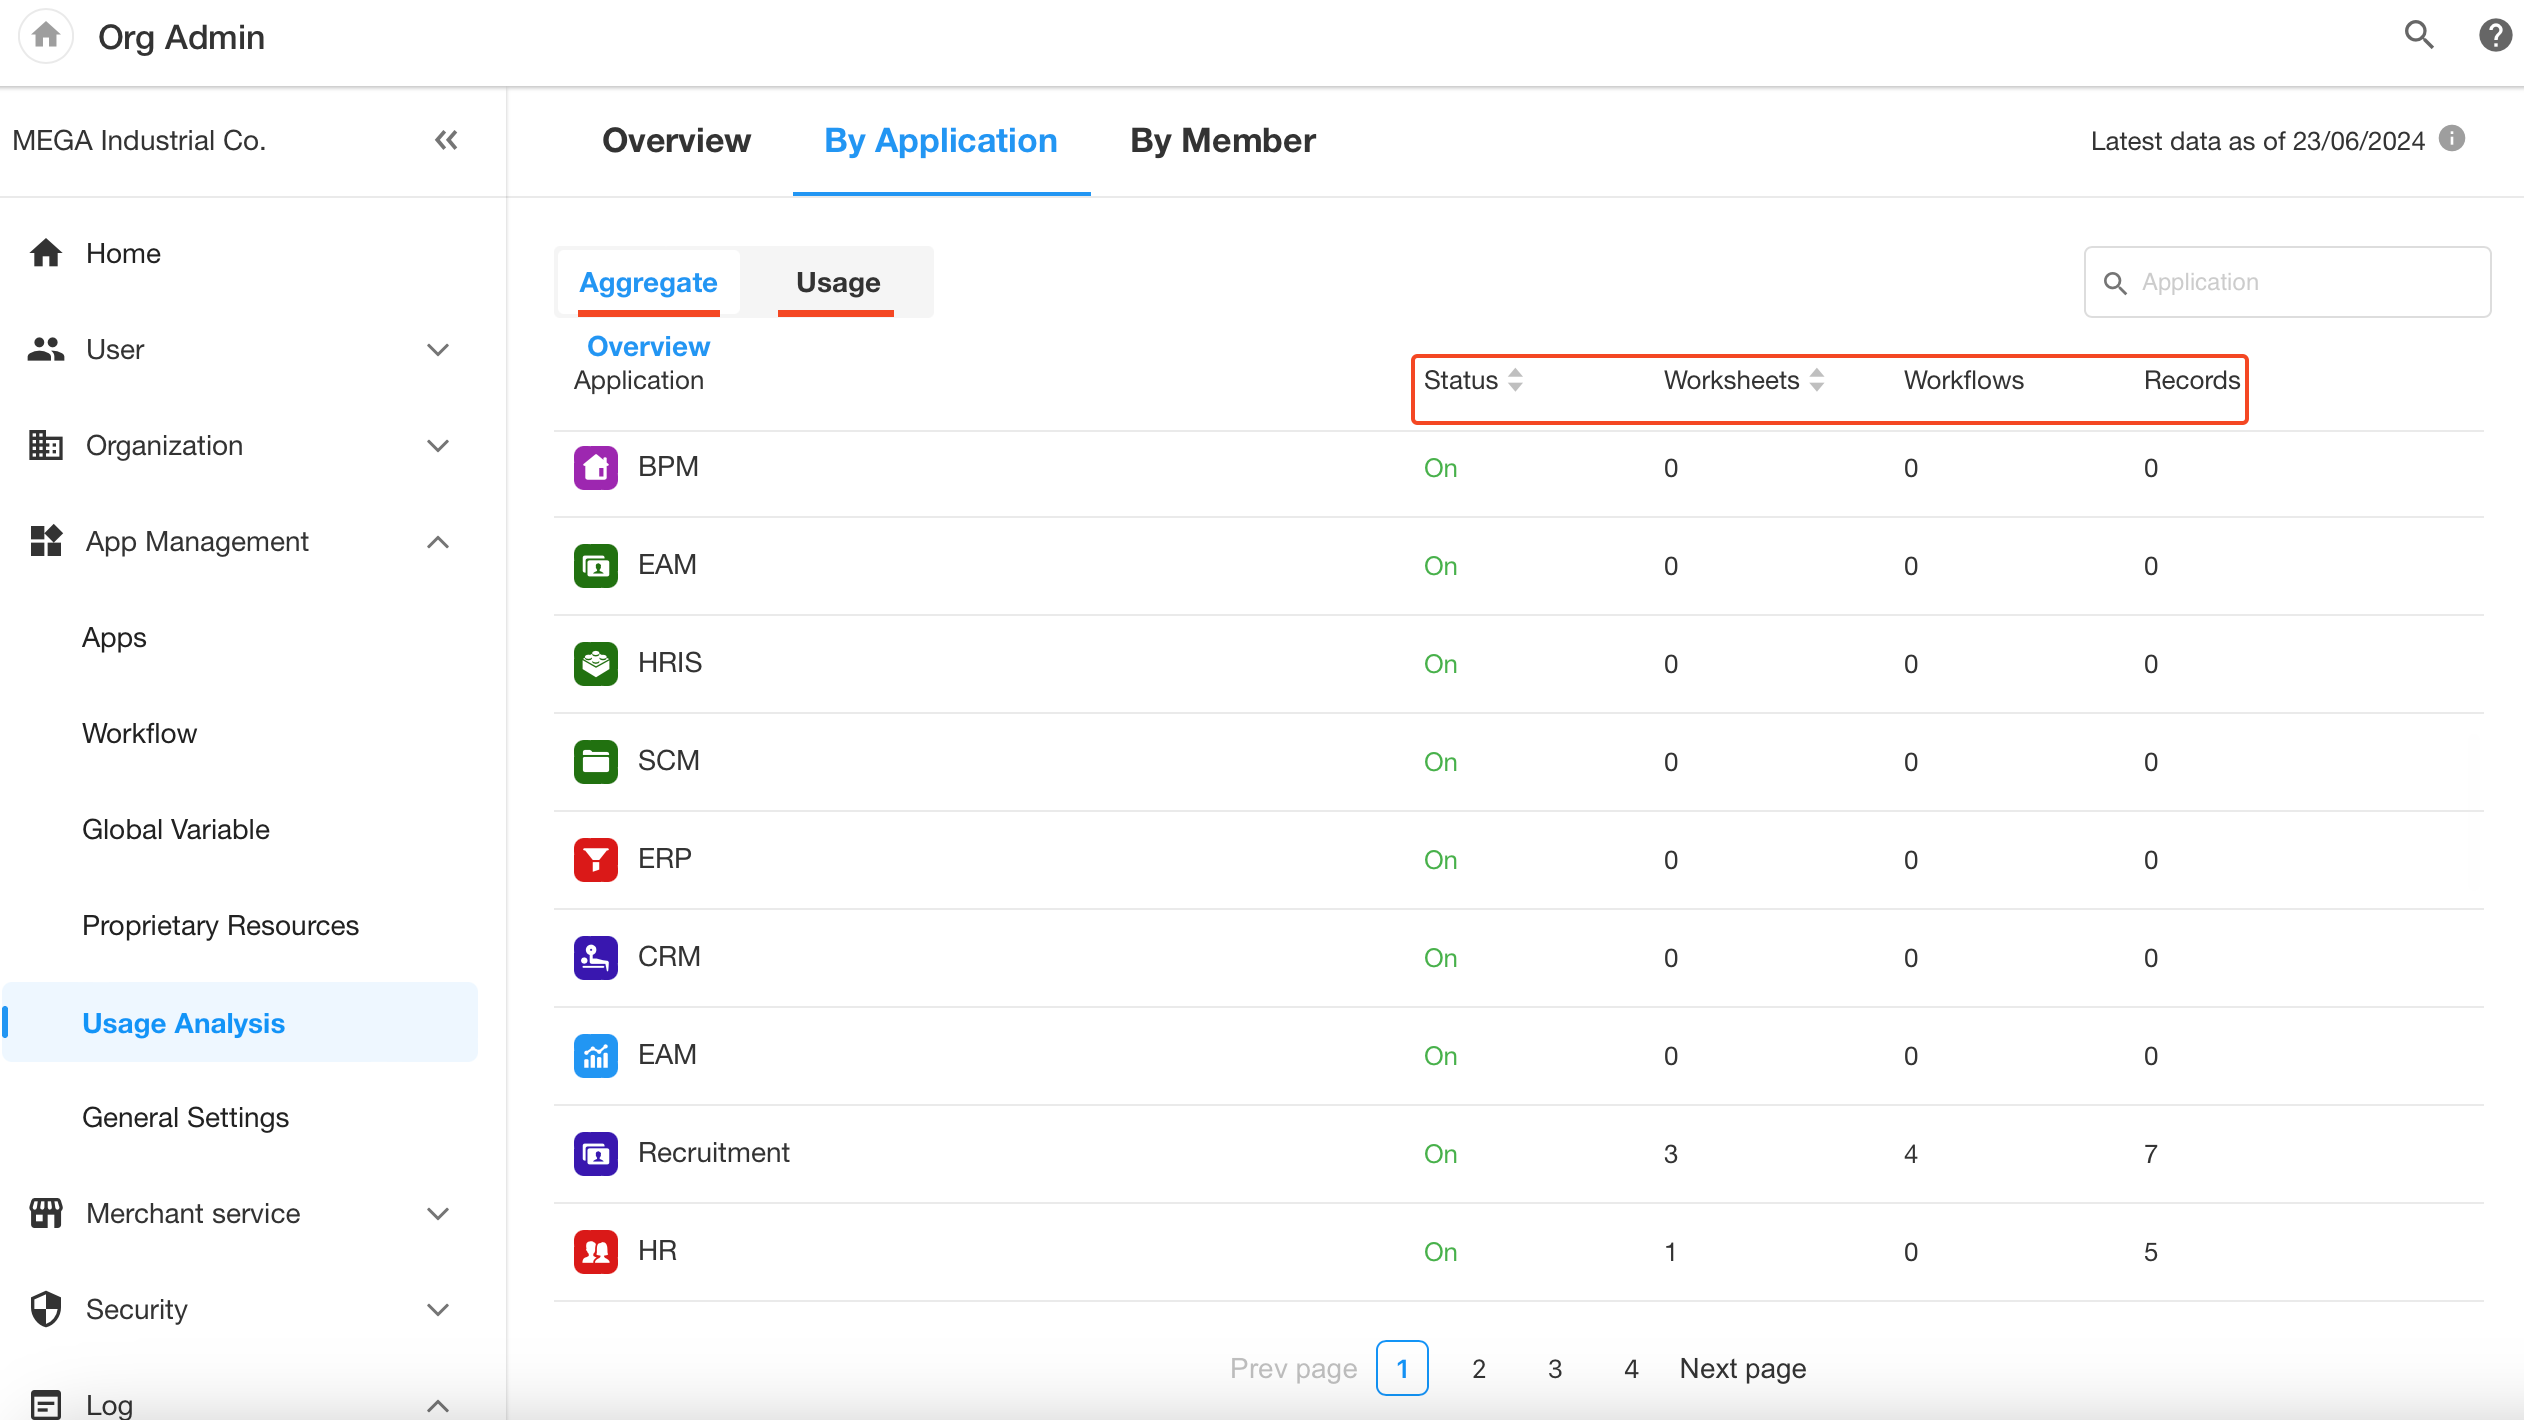
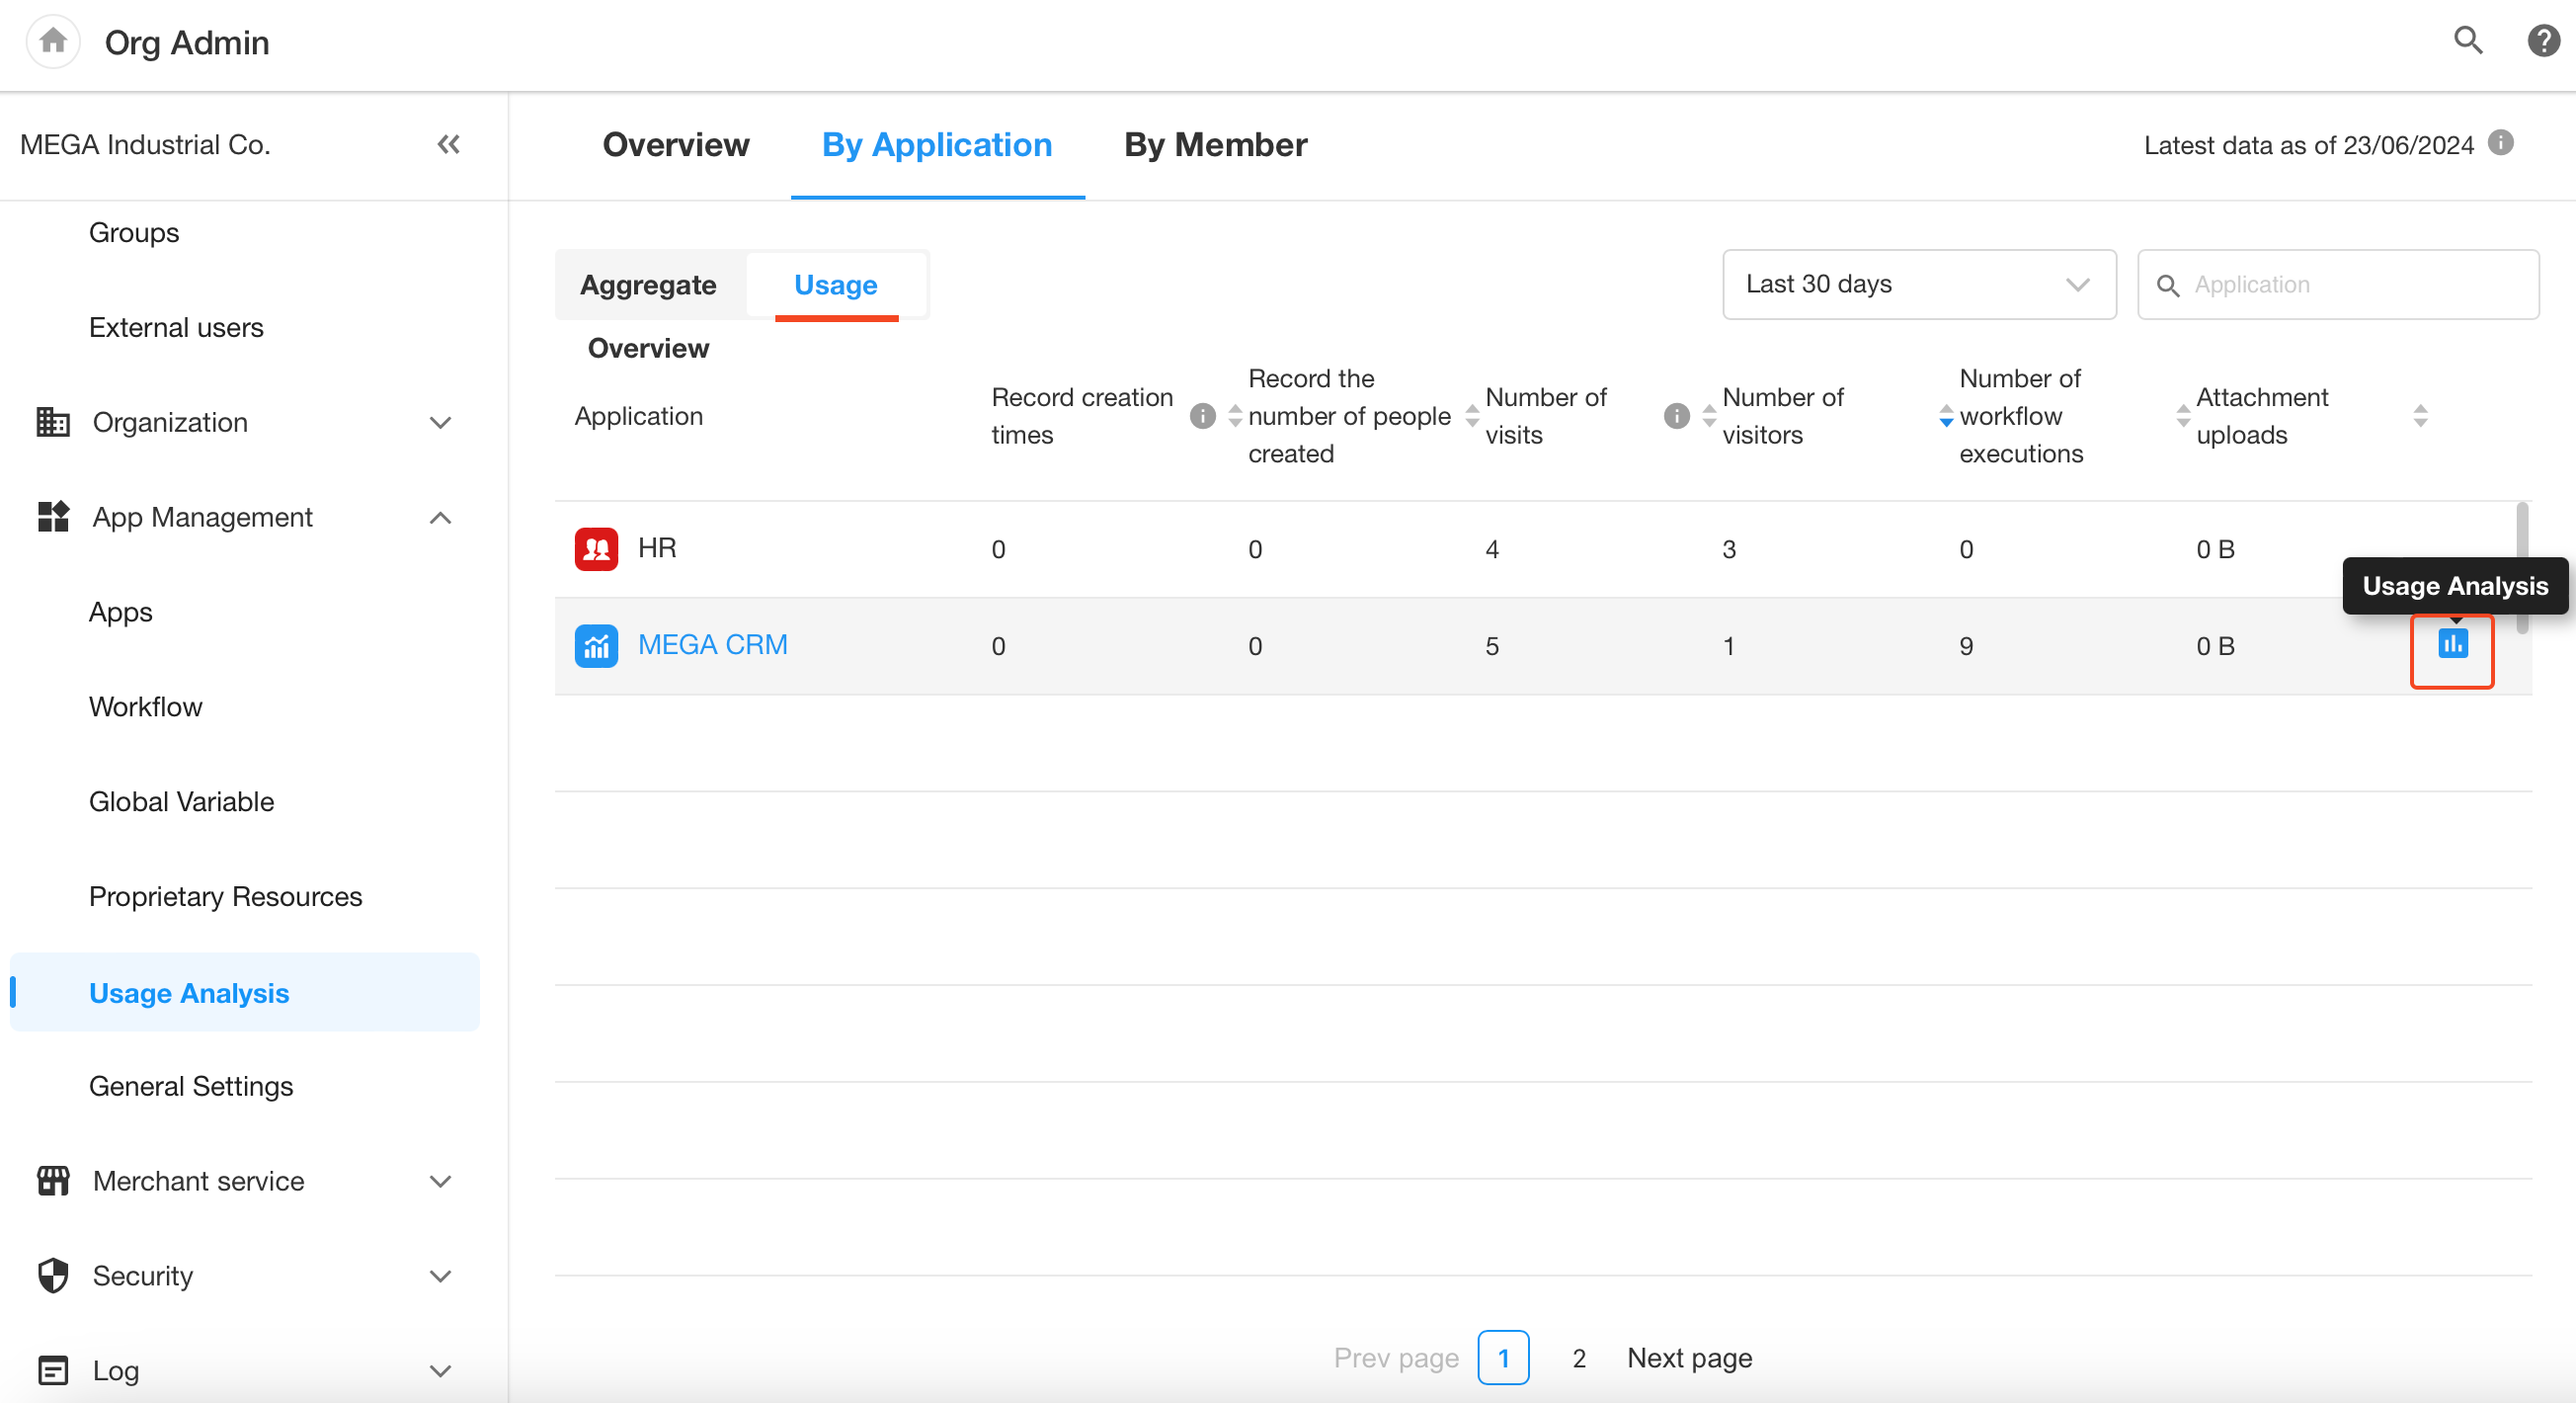
Usage
Here it counts the following items in each application (including closed ones):
- Number of records
- Number of creators of the records
- Application visits (participants)
- Application visits (times)
- Workflow executions
- Number of attachments
Note: The above data can be sorted for viewing
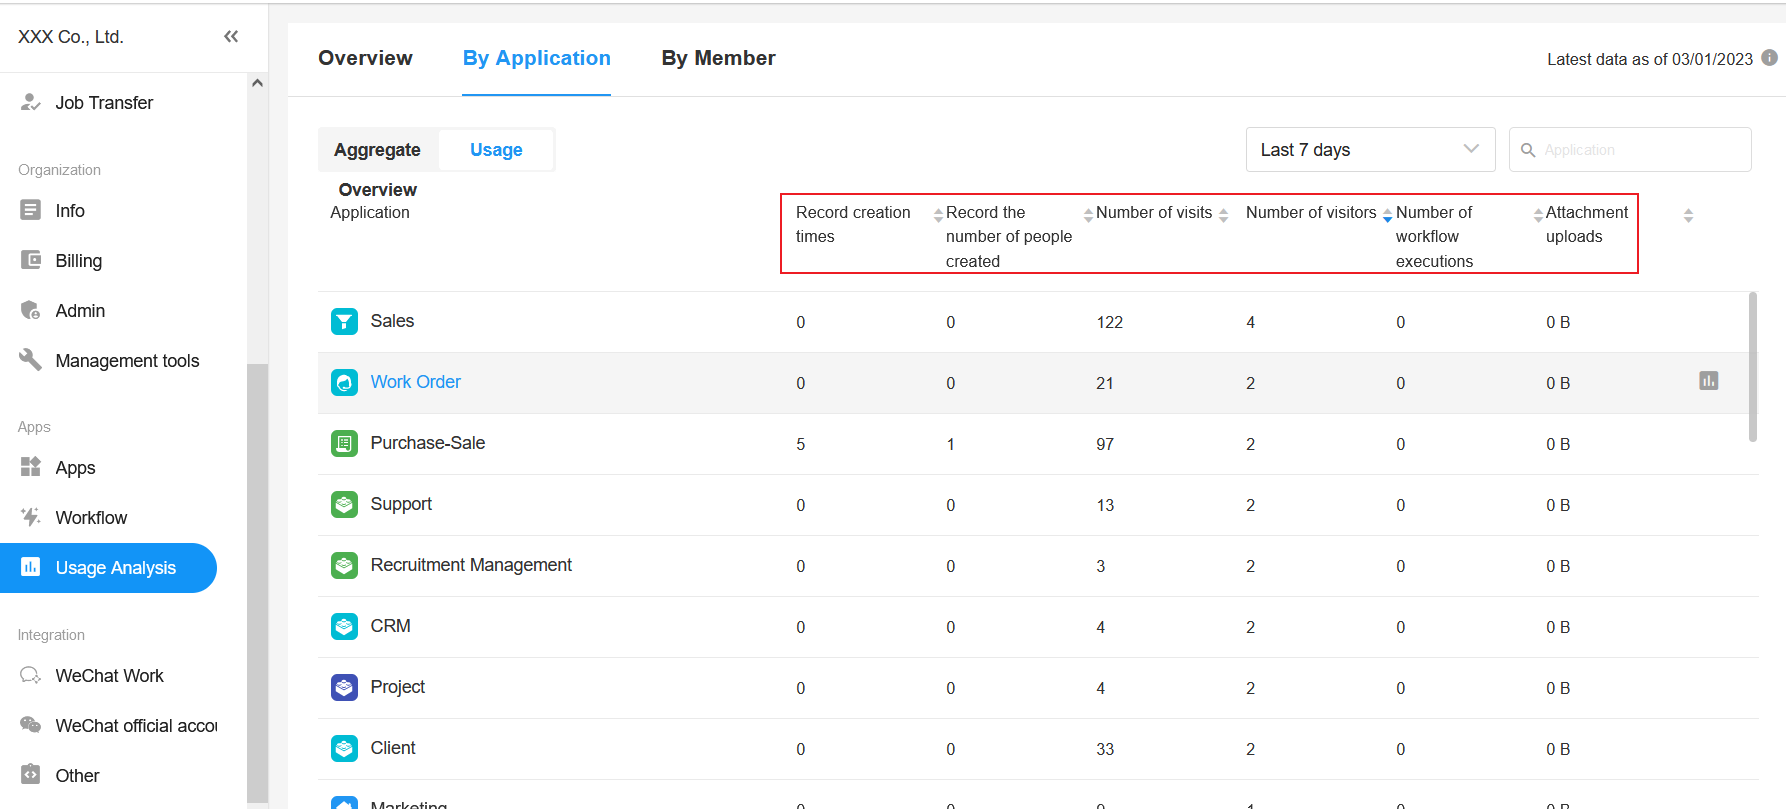
Operation column: to view statistics and analysis of every single application.
Mouse over the application name and click on the icon in the far-right column to view the usage analysis for the application.
3. By Member
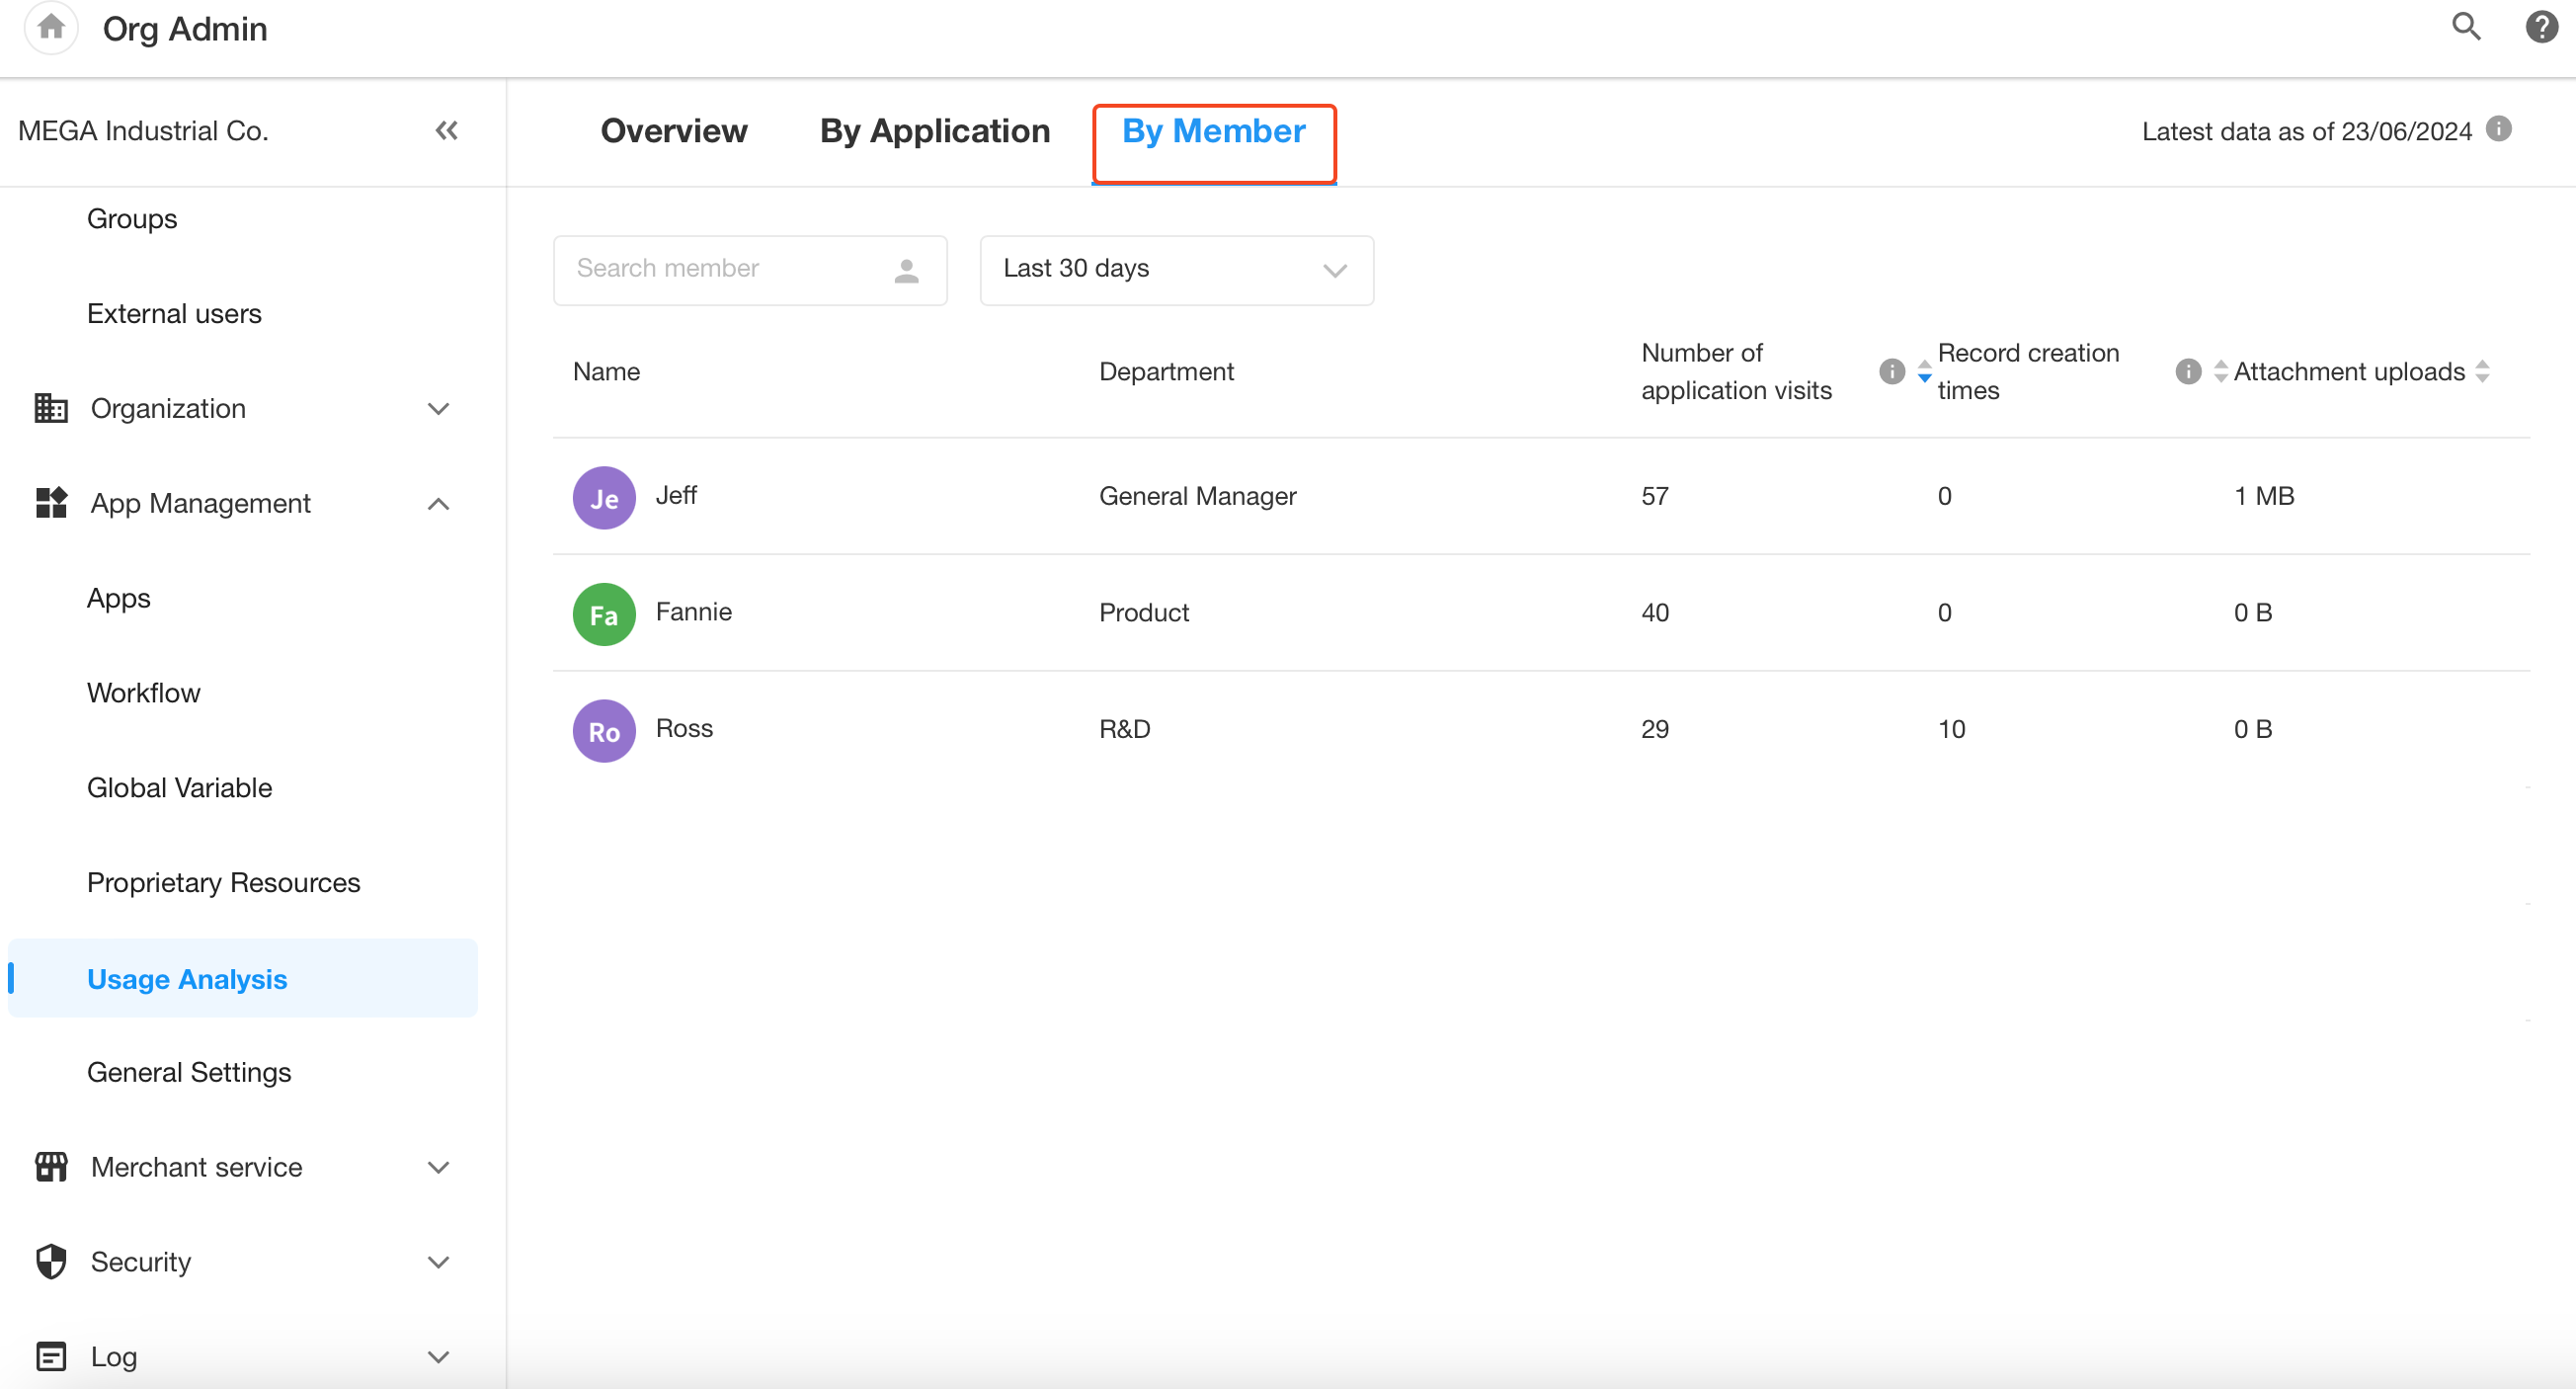
You can search for members and select the time frame to view the detailed data including application visits, number of record creations, and attachments.
The following operations count:
-
Click the icon to enter the application
-
Refresh the page
-
Enter the application through the notification message
In an application, operations like switching worksheets or views do not count.