ER Diagram
The Entity-Relationship Diagram (ER Diagram) is a graphical tool used to describe the relationships between worksheets in an application. In complex applications, there may be hundreds of entity objects, which can lead to issues such as data redundancy, difficult permission management, and increased system maintenance complexity. ER diagrams can help Application Admin clarify complex data structures and relationships, view data structures more intuitively, and improve communication and collaboration efficiency. Through graphical symbols and relationship lines, one can clearly understand the connections or relationships between entities (relationship fields and subform fields), such as one-to-one relationship, one-to-many relationship, and many-to-many relationship.
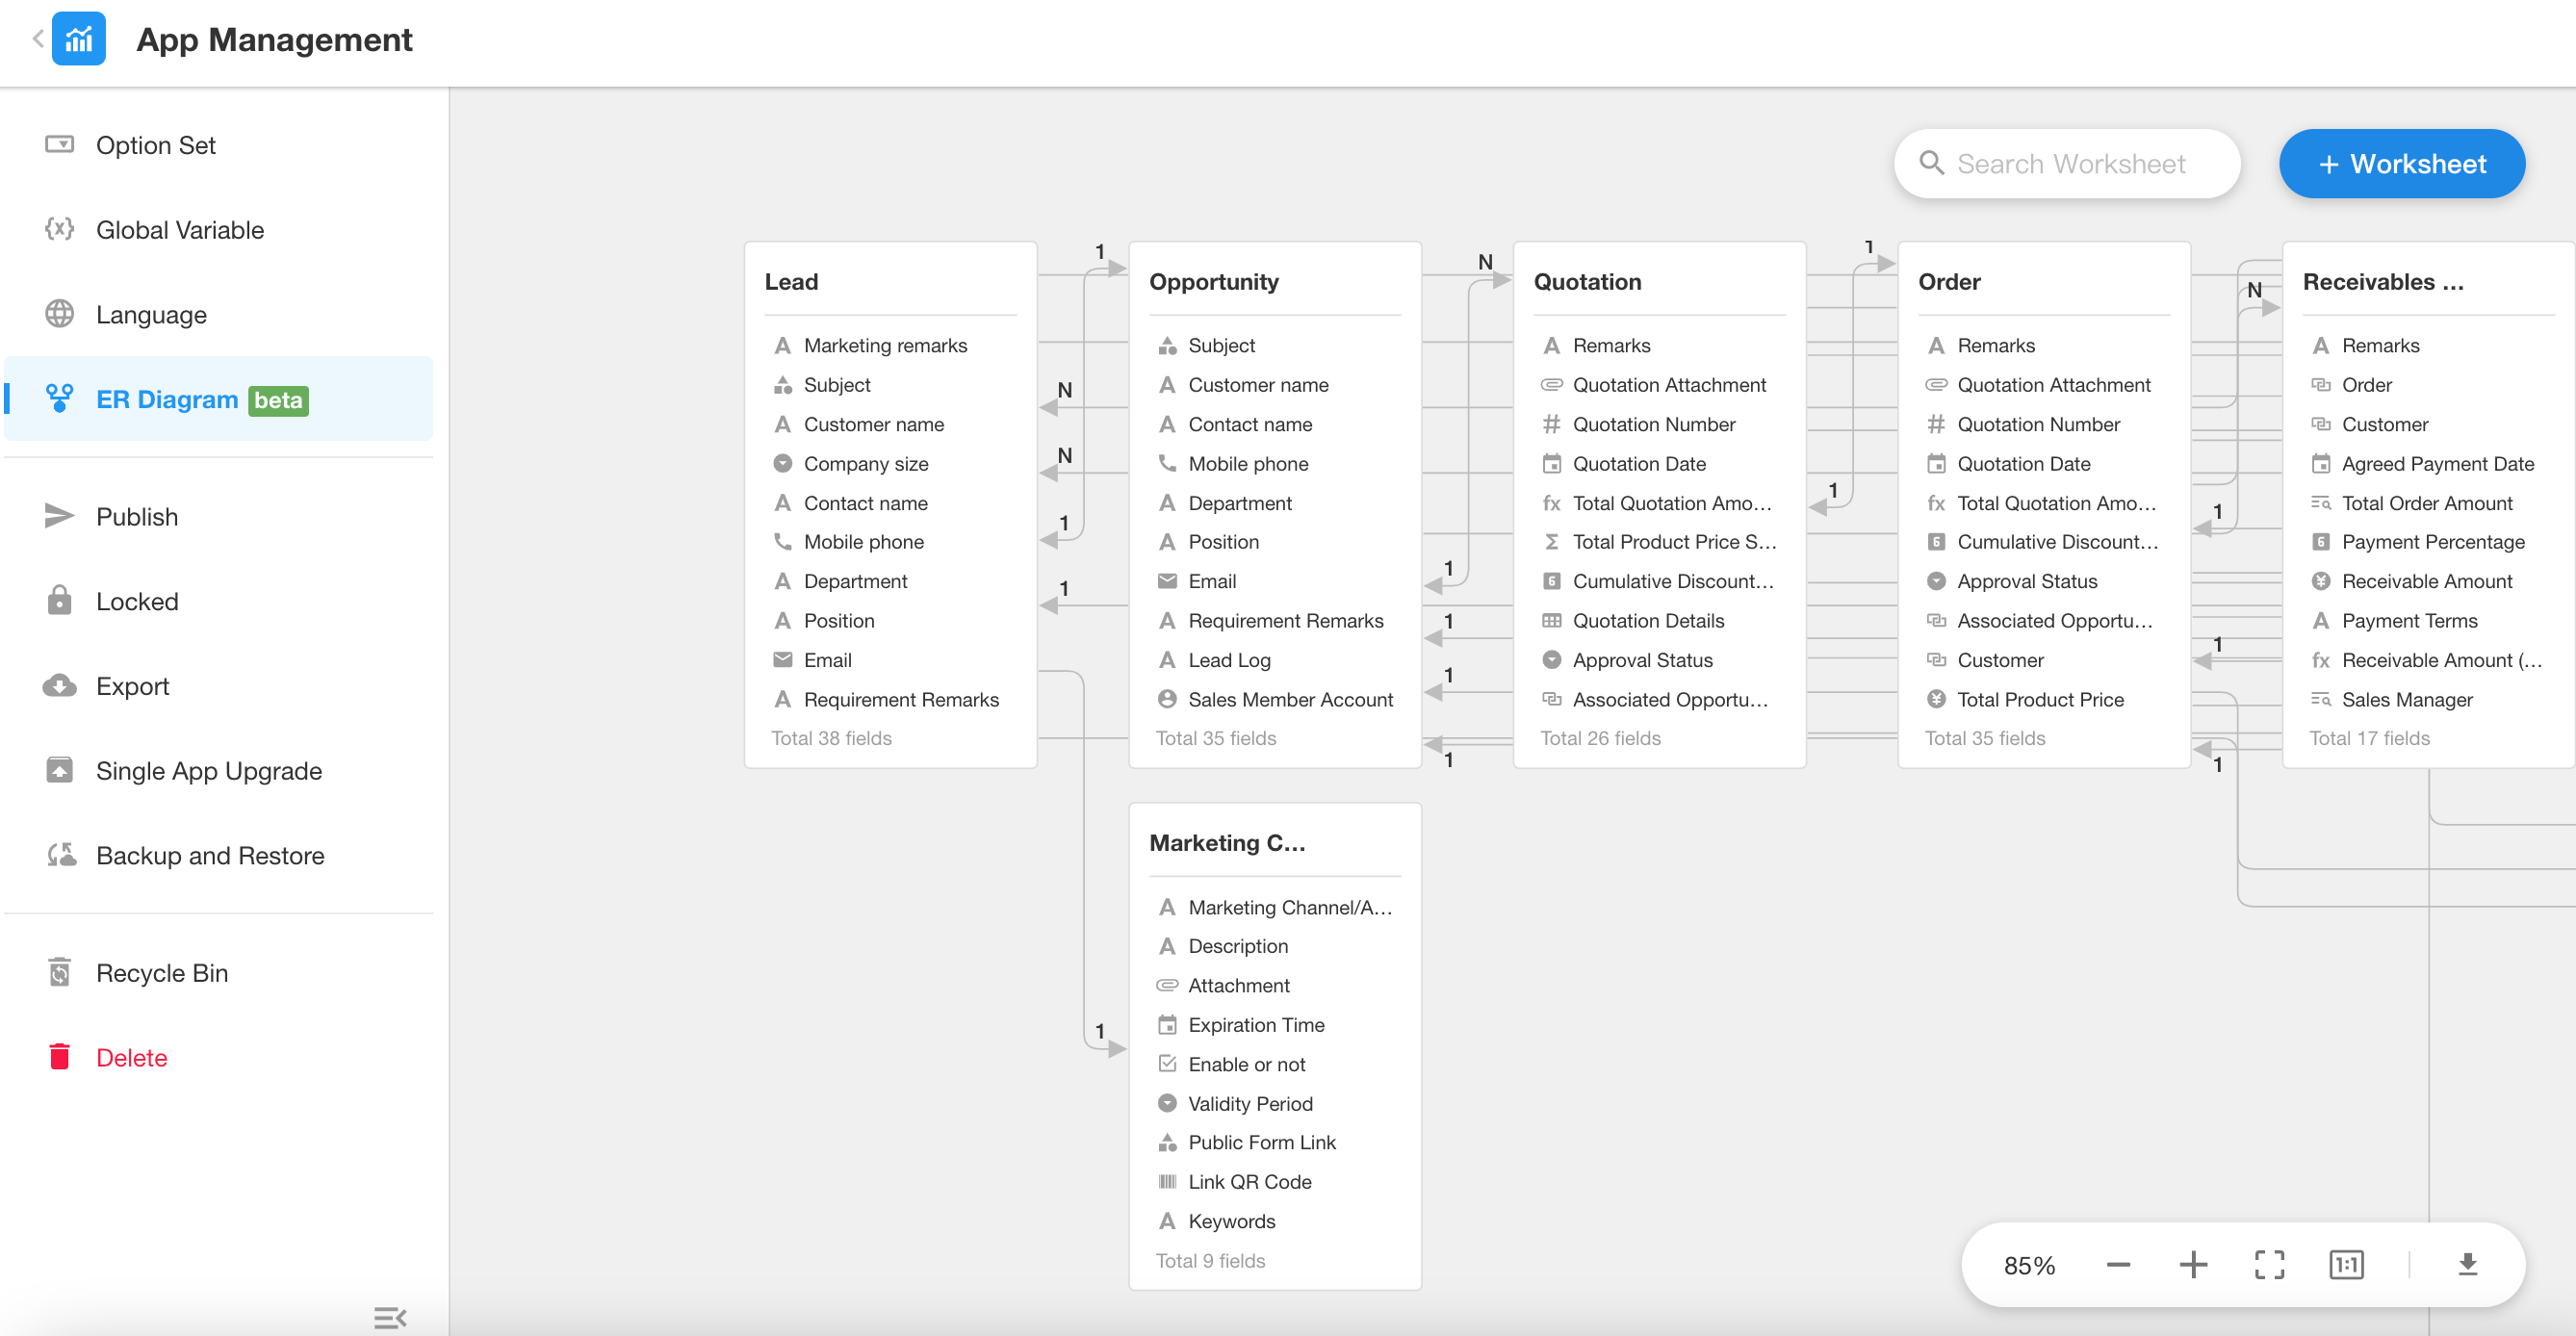
Example of an ER Diagram: The diagram below shows the structure of each worksheet in the MEGA CRM application and the relationships with other worksheets.
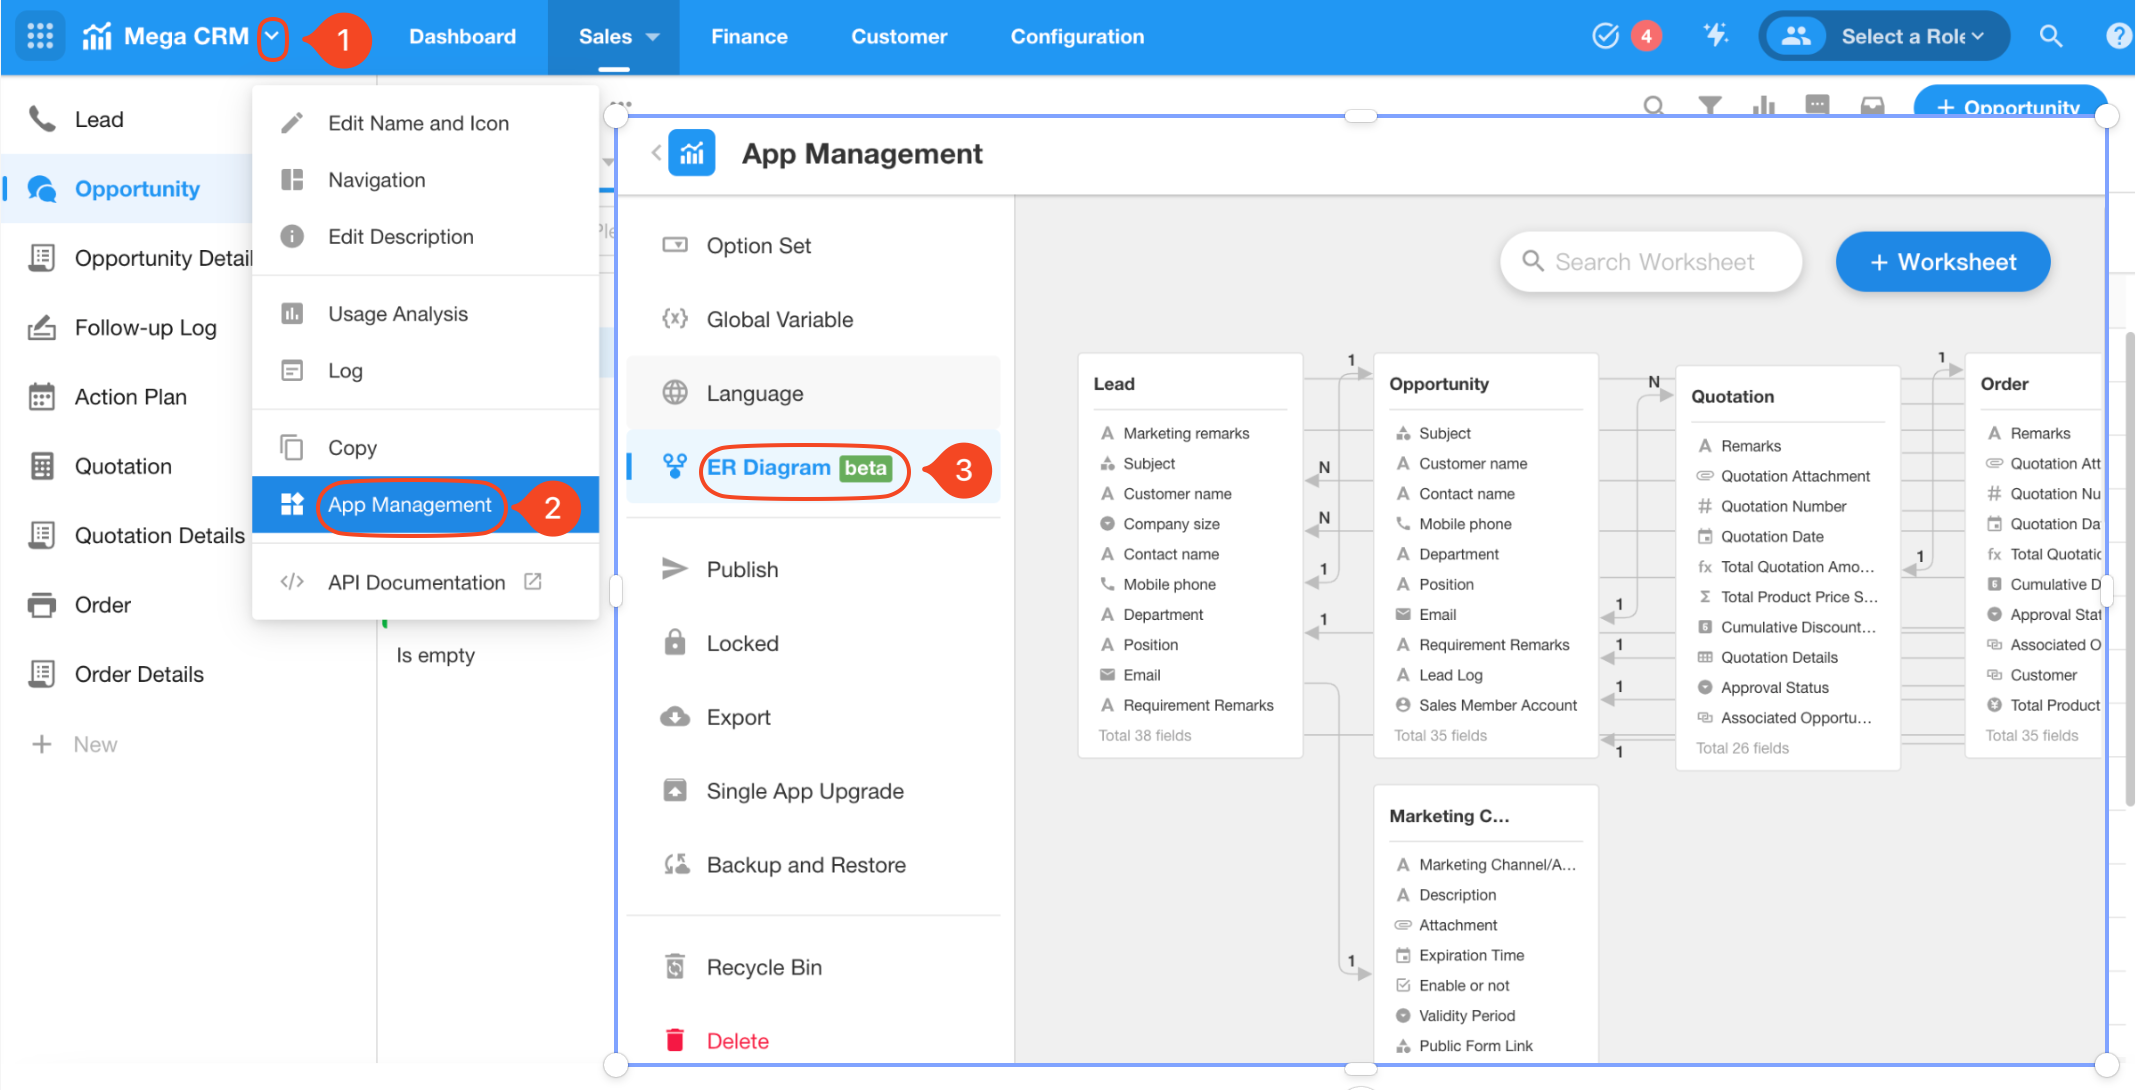
Entrance to ER Diagram
Application Admin can access the current application's ER diagram by going to[App Management] > [ER Diagram].
Relationship Lines
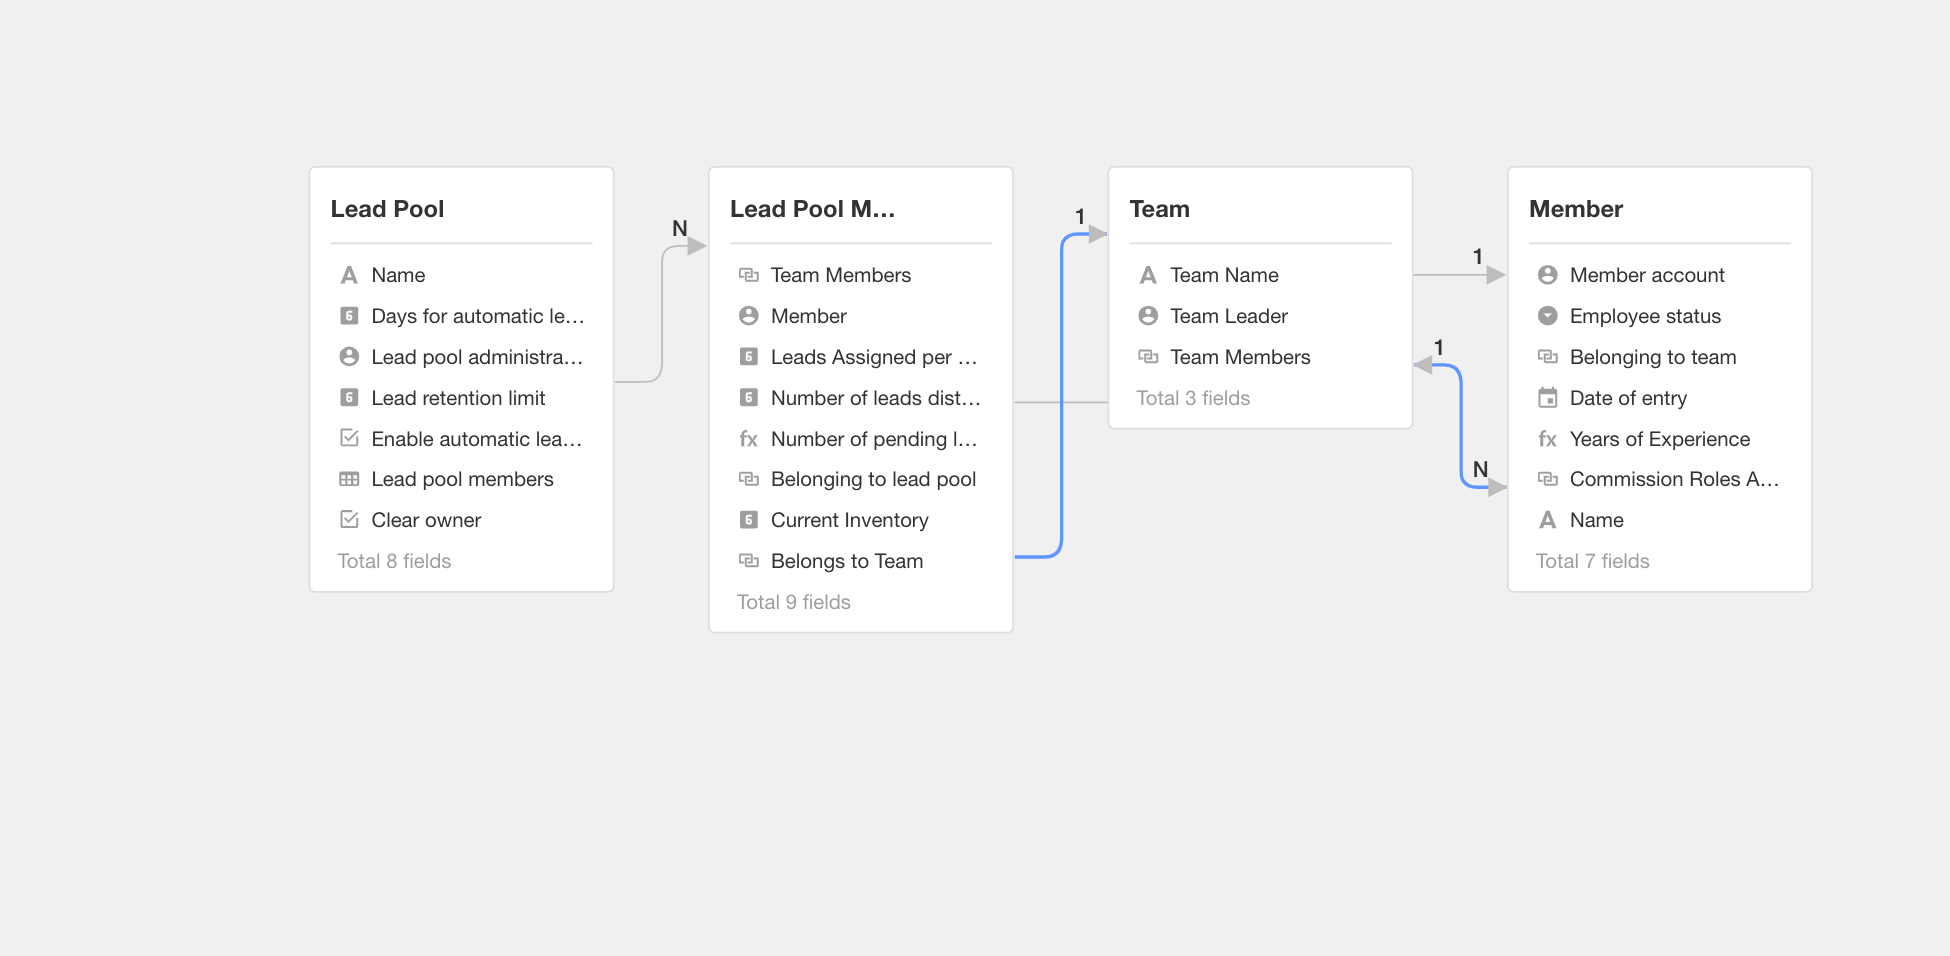
The relationship lines in the ER diagram and the numbers describe the relationship between two worksheets.
-
One-way and Two-way Relationships
If there is only one arrow at both ends of the relationship line, it represents a one-way relationship. If there are arrows at both ends, it indicates a two-way relationship.
-
Types of Relationships
The number 1 on the arrow indicates a relationship with only one record, while N represents a relationship with multiple records.
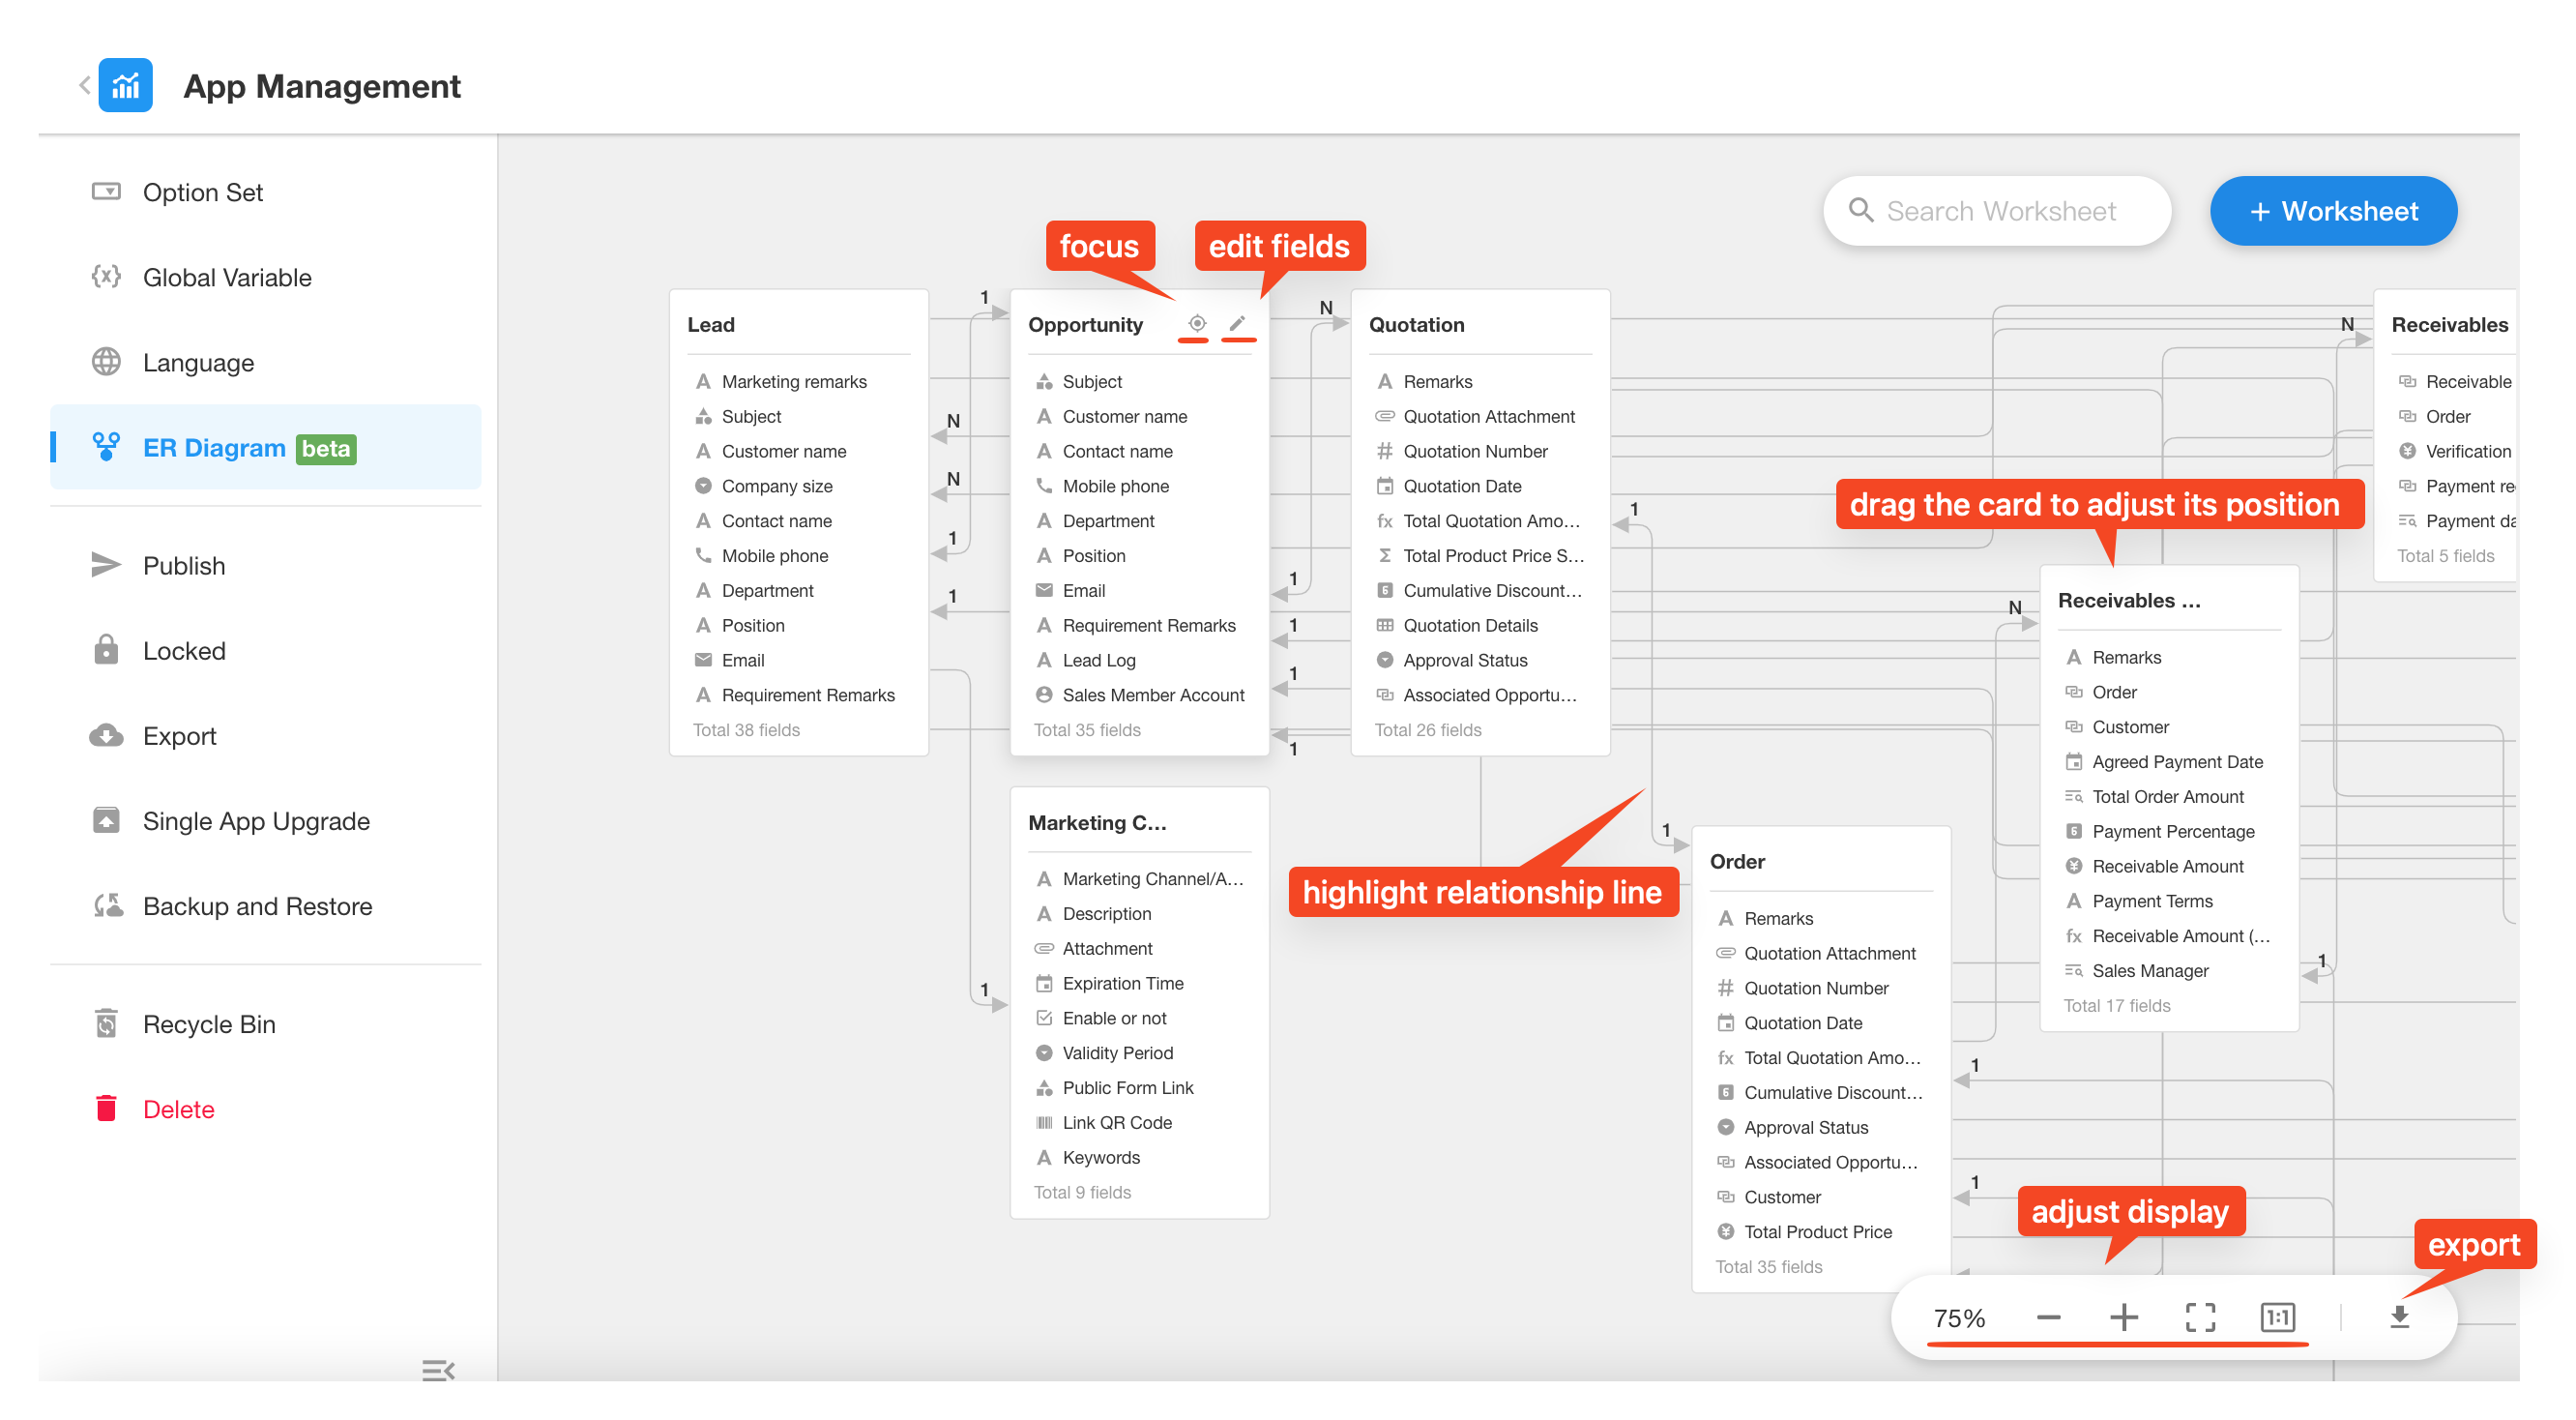
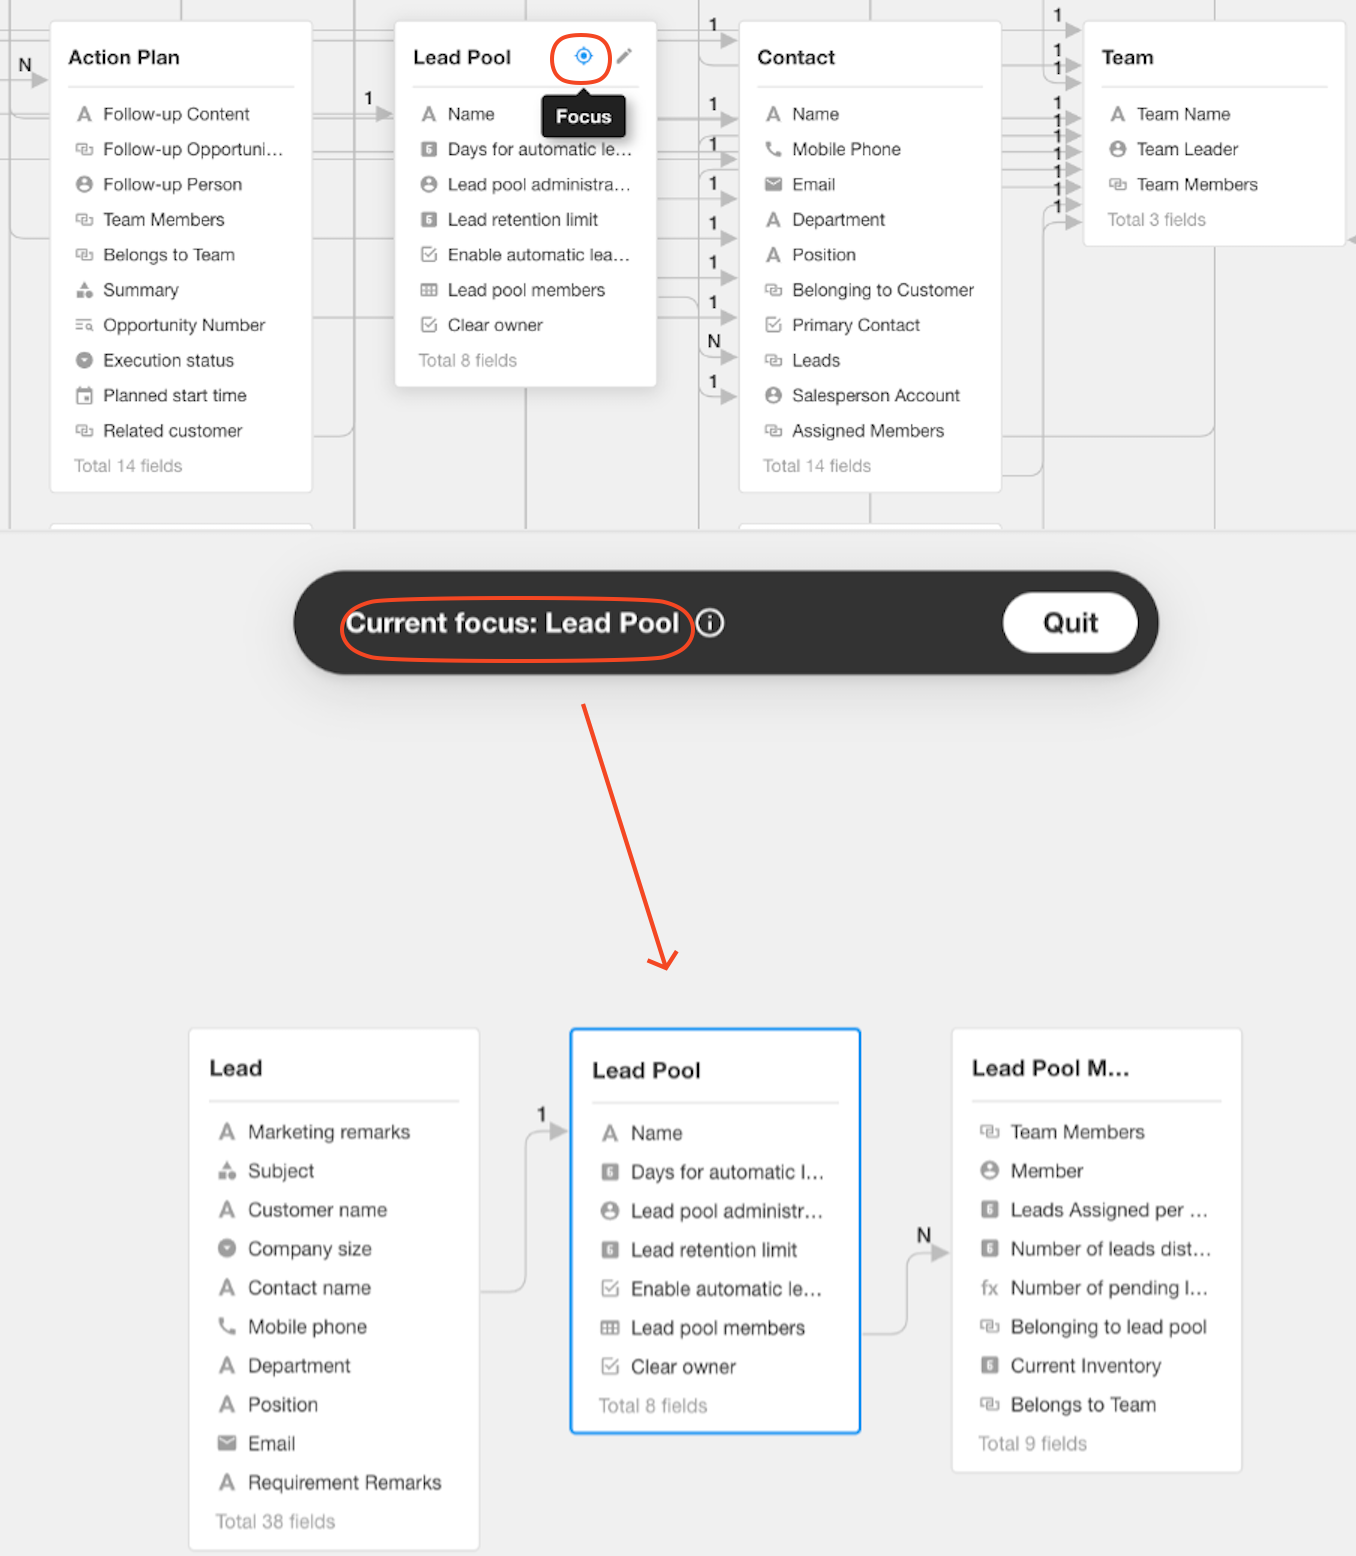
Focus Display
By clicking the [Focus] button on a worksheet card, you can display only the worksheets related to it and their relationships.
Other Operations
In the ER diagram, you can also perform the following operations:
- Hover over a worksheet card and click the [Edit] button to directly edit the fields in the worksheet.
- Drag the worksheet card to adjust its position on the canvas.
- Click the relationship lines to highlight them.
- Create or search for worksheets.
- Adjust the display scale of the canvas.
- Export the ER diagram.